Final report - Integrated Land Management Bureau
Final report - Integrated Land Management Bureau
Final report - Integrated Land Management Bureau

Create successful ePaper yourself
Turn your PDF publications into a flip-book with our unique Google optimized e-Paper software.
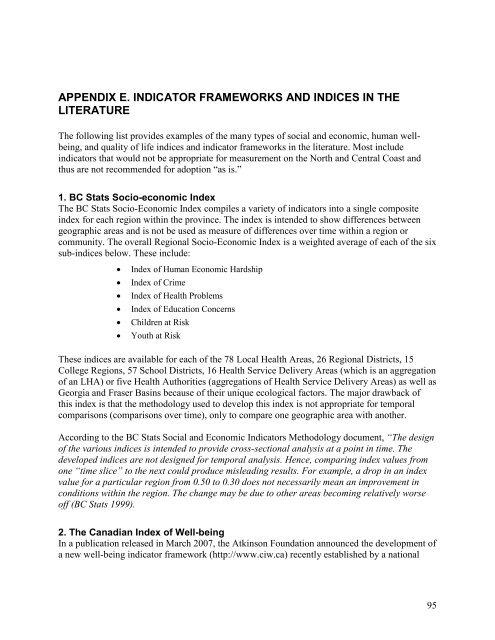
APPENDIX E. INDICATOR FRAMEWORKS AND INDICES IN THE<br />
LITERATURE<br />
The following list provides examples of the many types of social and economic, human wellbeing,<br />
and quality of life indices and indicator frameworks in the literature. Most include<br />
indicators that would not be appropriate for measurement on the North and Central Coast and<br />
thus are not recommended for adoption “as is.”<br />
1. BC Stats Socio-economic Index<br />
The BC Stats Socio-Economic Index compiles a variety of indicators into a single composite<br />
index for each region within the province. The index is intended to show differences between<br />
geographic areas and is not be used as measure of differences over time within a region or<br />
community. The overall Regional Socio-Economic Index is a weighted average of each of the six<br />
sub-indices below. These include:<br />
• Index of Human Economic Hardship<br />
• Index of Crime<br />
• Index of Health Problems<br />
• Index of Education Concerns<br />
• Children at Risk<br />
• Youth at Risk<br />
These indices are available for each of the 78 Local Health Areas, 26 Regional Districts, 15<br />
College Regions, 57 School Districts, 16 Health Service Delivery Areas (which is an aggregation<br />
of an LHA) or five Health Authorities (aggregations of Health Service Delivery Areas) as well as<br />
Georgia and Fraser Basins because of their unique ecological factors. The major drawback of<br />
this index is that the methodology used to develop this index is not appropriate for temporal<br />
comparisons (comparisons over time), only to compare one geographic area with another.<br />
According to the BC Stats Social and Economic Indicators Methodology document, “The design<br />
of the various indices is intended to provide cross-sectional analysis at a point in time. The<br />
developed indices are not designed for temporal analysis. Hence, comparing index values from<br />
one “time slice” to the next could produce misleading results. For example, a drop in an index<br />
value for a particular region from 0.50 to 0.30 does not necessarily mean an improvement in<br />
conditions within the region. The change may be due to other areas becoming relatively worse<br />
off (BC Stats 1999).<br />
2. The Canadian Index of Well-being<br />
In a publication released in March 2007, the Atkinson Foundation announced the development of<br />
a new well-being indicator framework (http://www.ciw.ca) recently established by a national<br />
95