Final report - Integrated Land Management Bureau
Final report - Integrated Land Management Bureau
Final report - Integrated Land Management Bureau

Create successful ePaper yourself
Turn your PDF publications into a flip-book with our unique Google optimized e-Paper software.
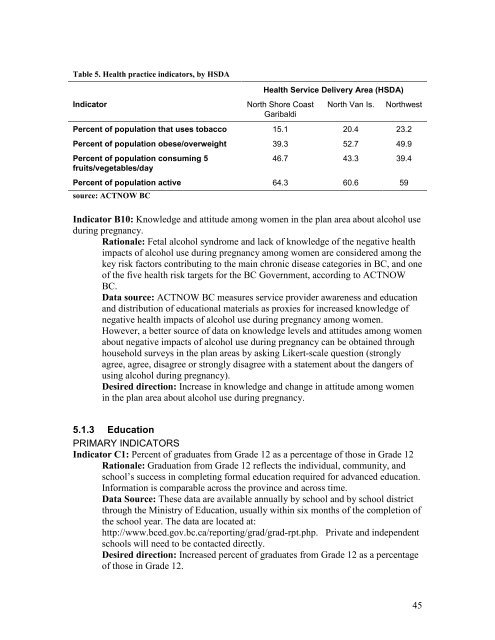
Table 5. Health practice indicators, by HSDA<br />
Indicator North Shore Coast<br />
Garibaldi<br />
Health Service Delivery Area (HSDA)<br />
North Van Is. Northwest<br />
Percent of population that uses tobacco 15.1 20.4 23.2<br />
Percent of population obese/overweight 39.3 52.7 49.9<br />
Percent of population consuming 5<br />
fruits/vegetables/day<br />
46.7 43.3 39.4<br />
Percent of population active 64.3 60.6 59<br />
source: ACTNOW BC<br />
Indicator B10: Knowledge and attitude among women in the plan area about alcohol use<br />
during pregnancy.<br />
Rationale: Fetal alcohol syndrome and lack of knowledge of the negative health<br />
impacts of alcohol use during pregnancy among women are considered among the<br />
key risk factors contributing to the main chronic disease categories in BC, and one<br />
of the five health risk targets for the BC Government, according to ACTNOW<br />
BC.<br />
Data source: ACTNOW BC measures service provider awareness and education<br />
and distribution of educational materials as proxies for increased knowledge of<br />
negative health impacts of alcohol use during pregnancy among women.<br />
However, a better source of data on knowledge levels and attitudes among women<br />
about negative impacts of alcohol use during pregnancy can be obtained through<br />
household surveys in the plan areas by asking Likert-scale question (strongly<br />
agree, agree, disagree or strongly disagree with a statement about the dangers of<br />
using alcohol during pregnancy).<br />
Desired direction: Increase in knowledge and change in attitude among women<br />
in the plan area about alcohol use during pregnancy.<br />
5.1.3 Education<br />
PRIMARY INDICATORS<br />
Indicator C1: Percent of graduates from Grade 12 as a percentage of those in Grade 12<br />
Rationale: Graduation from Grade 12 reflects the individual, community, and<br />
school’s success in completing formal education required for advanced education.<br />
Information is comparable across the province and across time.<br />
Data Source: These data are available annually by school and by school district<br />
through the Ministry of Education, usually within six months of the completion of<br />
the school year. The data are located at:<br />
http://www.bced.gov.bc.ca/<strong>report</strong>ing/grad/grad-rpt.php. Private and independent<br />
schools will need to be contacted directly.<br />
Desired direction: Increased percent of graduates from Grade 12 as a percentage<br />
of those in Grade 12.<br />
45