Final report - Integrated Land Management Bureau
Final report - Integrated Land Management Bureau
Final report - Integrated Land Management Bureau

You also want an ePaper? Increase the reach of your titles
YUMPU automatically turns print PDFs into web optimized ePapers that Google loves.
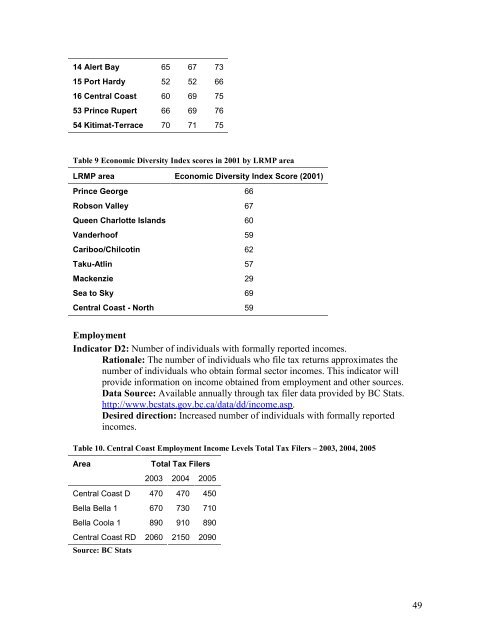
14 Alert Bay 65 67 73<br />
15 Port Hardy 52 52 66<br />
16 Central Coast 60 69 75<br />
53 Prince Rupert 66 69 76<br />
54 Kitimat-Terrace 70 71 75<br />
Table 9 Economic Diversity Index scores in 2001 by LRMP area<br />
LRMP area Economic Diversity Index Score (2001)<br />
Prince George 66<br />
Robson Valley 67<br />
Queen Charlotte Islands 60<br />
Vanderhoof 59<br />
Cariboo/Chilcotin 62<br />
Taku-Atlin 57<br />
Mackenzie 29<br />
Sea to Sky 69<br />
Central Coast - North 59<br />
Employment<br />
Indicator D2: Number of individuals with formally <strong>report</strong>ed incomes.<br />
Rationale: The number of individuals who file tax returns approximates the<br />
number of individuals who obtain formal sector incomes. This indicator will<br />
provide information on income obtained from employment and other sources.<br />
Data Source: Available annually through tax filer data provided by BC Stats.<br />
http://www.bcstats.gov.bc.ca/data/dd/income.asp.<br />
Desired direction: Increased number of individuals with formally <strong>report</strong>ed<br />
incomes.<br />
Table 10. Central Coast Employment Income Levels Total Tax Filers – 2003, 2004, 2005<br />
Area<br />
Total Tax Filers<br />
2003 2004 2005<br />
Central Coast D 470 470 450<br />
Bella Bella 1 670 730 710<br />
Bella Coola 1 890 910 890<br />
Central Coast RD 2060 2150 2090<br />
Source: BC Stats<br />
49