Final report - Integrated Land Management Bureau
Final report - Integrated Land Management Bureau
Final report - Integrated Land Management Bureau

Create successful ePaper yourself
Turn your PDF publications into a flip-book with our unique Google optimized e-Paper software.
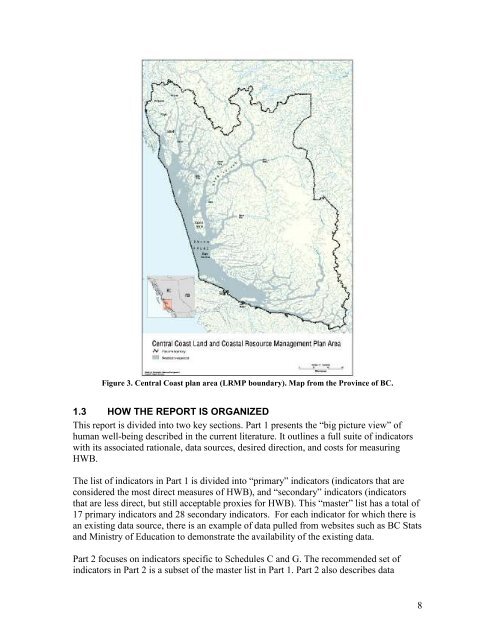
Figure 3. Central Coast plan area (LRMP boundary). Map from the Province of BC.<br />
1.3 HOW THE REPORT IS ORGANIZED<br />
This <strong>report</strong> is divided into two key sections. Part 1 presents the “big picture view” of<br />
human well-being described in the current literature. It outlines a full suite of indicators<br />
with its associated rationale, data sources, desired direction, and costs for measuring<br />
HWB.<br />
The list of indicators in Part 1 is divided into “primary” indicators (indicators that are<br />
considered the most direct measures of HWB), and “secondary” indicators (indicators<br />
that are less direct, but still acceptable proxies for HWB). This “master” list has a total of<br />
17 primary indicators and 28 secondary indicators. For each indicator for which there is<br />
an existing data source, there is an example of data pulled from websites such as BC Stats<br />
and Ministry of Education to demonstrate the availability of the existing data.<br />
Part 2 focuses on indicators specific to Schedules C and G. The recommended set of<br />
indicators in Part 2 is a subset of the master list in Part 1. Part 2 also describes data<br />
8