The evolution of professionalism - Centre for Policy Studies in ...
The evolution of professionalism - Centre for Policy Studies in ...
The evolution of professionalism - Centre for Policy Studies in ...

You also want an ePaper? Increase the reach of your titles
YUMPU automatically turns print PDFs into web optimized ePapers that Google loves.
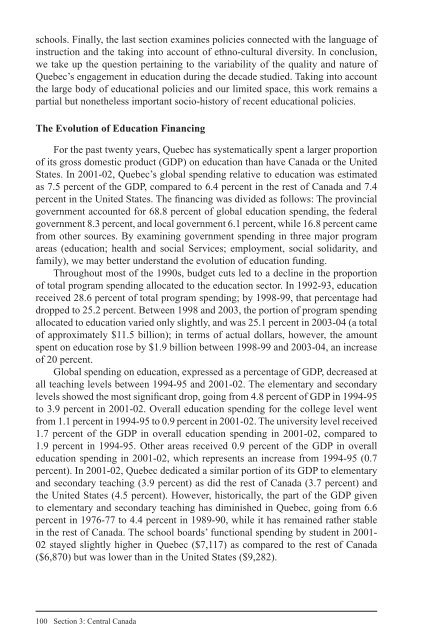
schools. F<strong>in</strong>ally, the last section exam<strong>in</strong>es policies connected with the language <strong>of</strong><br />
<strong>in</strong>struction and the tak<strong>in</strong>g <strong>in</strong>to account <strong>of</strong> ethno-cultural diversity. In conclusion,<br />
we take up the question perta<strong>in</strong><strong>in</strong>g to the variability <strong>of</strong> the quality and nature <strong>of</strong><br />
Quebec’s engagement <strong>in</strong> education dur<strong>in</strong>g the decade studied. Tak<strong>in</strong>g <strong>in</strong>to account<br />
the large body <strong>of</strong> educational policies and our limited space, this work rema<strong>in</strong>s a<br />
partial but nonetheless important socio-history <strong>of</strong> recent educational policies.<br />
<strong>The</strong> Evolution <strong>of</strong> Education F<strong>in</strong>anc<strong>in</strong>g<br />
For the past twenty years, Quebec has systematically spent a larger proportion<br />
<strong>of</strong> its gross domestic product (GDP) on education than have Canada or the United<br />
States. In 2001-02, Quebec’s global spend<strong>in</strong>g relative to education was estimated<br />
as 7.5 percent <strong>of</strong> the GDP, compared to 6.4 percent <strong>in</strong> the rest <strong>of</strong> Canada and 7.4<br />
percent <strong>in</strong> the United States. <strong>The</strong> fi nanc<strong>in</strong>g was divided as follows: <strong>The</strong> prov<strong>in</strong>cial<br />
government accounted <strong>for</strong> 68.8 percent <strong>of</strong> global education spend<strong>in</strong>g, the federal<br />
government 8.3 percent, and local government 6.1 percent, while 16.8 percent came<br />
from other sources. By exam<strong>in</strong><strong>in</strong>g government spend<strong>in</strong>g <strong>in</strong> three major program<br />
areas (education; health and social Services; employment, social solidarity, and<br />
family), we may better understand the <strong>evolution</strong> <strong>of</strong> education fund<strong>in</strong>g.<br />
Throughout most <strong>of</strong> the 1990s, budget cuts led to a decl<strong>in</strong>e <strong>in</strong> the proportion<br />
<strong>of</strong> total program spend<strong>in</strong>g allocated to the education sector. In 1992-93, education<br />
received 28.6 percent <strong>of</strong> total program spend<strong>in</strong>g; by 1998-99, that percentage had<br />
dropped to 25.2 percent. Between 1998 and 2003, the portion <strong>of</strong> program spend<strong>in</strong>g<br />
allocated to education varied only slightly, and was 25.1 percent <strong>in</strong> 2003-04 (a total<br />
<strong>of</strong> approximately $11.5 billion); <strong>in</strong> terms <strong>of</strong> actual dollars, however, the amount<br />
spent on education rose by $1.9 billion between 1998-99 and 2003-04, an <strong>in</strong>crease<br />
<strong>of</strong> 20 percent.<br />
Global spend<strong>in</strong>g on education, expressed as a percentage <strong>of</strong> GDP, decreased at<br />
all teach<strong>in</strong>g levels between 1994-95 and 2001-02. <strong>The</strong> elementary and secondary<br />
levels showed the most signifi cant drop, go<strong>in</strong>g from 4.8 percent <strong>of</strong> GDP <strong>in</strong> 1994-95<br />
to 3.9 percent <strong>in</strong> 2001-02. Overall education spend<strong>in</strong>g <strong>for</strong> the college level went<br />
from 1.1 percent <strong>in</strong> 1994-95 to 0.9 percent <strong>in</strong> 2001-02. <strong>The</strong> university level received<br />
1.7 percent <strong>of</strong> the GDP <strong>in</strong> overall education spend<strong>in</strong>g <strong>in</strong> 2001-02, compared to<br />
1.9 percent <strong>in</strong> 1994-95. Other areas received 0.9 percent <strong>of</strong> the GDP <strong>in</strong> overall<br />
education spend<strong>in</strong>g <strong>in</strong> 2001-02, which represents an <strong>in</strong>crease from 1994-95 (0.7<br />
percent). In 2001-02, Quebec dedicated a similar portion <strong>of</strong> its GDP to elementary<br />
and secondary teach<strong>in</strong>g (3.9 percent) as did the rest <strong>of</strong> Canada (3.7 percent) and<br />
the United States (4.5 percent). However, historically, the part <strong>of</strong> the GDP given<br />
to elementary and secondary teach<strong>in</strong>g has dim<strong>in</strong>ished <strong>in</strong> Quebec, go<strong>in</strong>g from 6.6<br />
percent <strong>in</strong> 1976-77 to 4.4 percent <strong>in</strong> 1989-90, while it has rema<strong>in</strong>ed rather stable<br />
<strong>in</strong> the rest <strong>of</strong> Canada. <strong>The</strong> school boards’ functional spend<strong>in</strong>g by student <strong>in</strong> 2001-<br />
02 stayed slightly higher <strong>in</strong> Quebec ($7,117) as compared to the rest <strong>of</strong> Canada<br />
($6,870) but was lower than <strong>in</strong> the United States ($9,282).<br />
100 Section 3: Central Canada