

Powering Europe - European Wind Energy Association
Powering Europe - European Wind Energy Association
Powering Europe - European Wind Energy Association

Create successful ePaper yourself
Turn your PDF publications into a flip-book with our unique Google optimized e-Paper software.
<strong>Wind</strong>generationandwindfarms–theessentials<br />
tablE 4: winD faRM ChaRaCtERistiCs<br />
* annual base, depends largely on the site’s average wind speed and on matching specific power and site average wind speed<br />
** per km2 ground or sea surface<br />
*** values valid onshore, including planned outages for regular maintenance<br />
1.2 Variability of wind power<br />
production<br />
<strong>Wind</strong> power: variable generation<br />
embedded in a variable electricity<br />
system<br />
<strong>Wind</strong> power fluctuates over time, mainly under the influence<br />
of meteorological conditions. The variations<br />
occur on all time scales: seconds, minutes, hours,<br />
42<br />
wind farm characteristic , typical value<br />
Rated wind farm sizes (MW) <br />
Number of turbines 1 – several hundreds<br />
Specific rated power offshore (MW/km²) <br />
Specific rated power onshore (MW/km²) <br />
Capacity factor (=load factor)* onshore / offshore (%) / <br />
Full load equivalent* (h) onshore/ offshore<br />
Specific annual energy output onshore** (GWh/km² year) 30 - 40<br />
Specific annual energy output offshore** (GWh/km² year) 20 – 50<br />
Technical availability*** (%) ; 97<br />
Demand and <strong>Wind</strong> [MW]<br />
<strong>Wind</strong> penetration (%)<br />
days, months, seasons, years. Understanding these<br />
variations and their predictability is of key importance<br />
to the integration and optimal utilisation of the power<br />
system. Both demand and supply are inherently variable<br />
in electric power systems, and are designed to<br />
cope with this variability in an efficient way. Electrical<br />
demand is highly variable, dependent on a large<br />
number of factors, such as the weather (ambient temperature),<br />
daylight conditions, factory and TV schedules,<br />
and so on. The system operator needs to manage<br />
both predictable and unpredictable events in the<br />
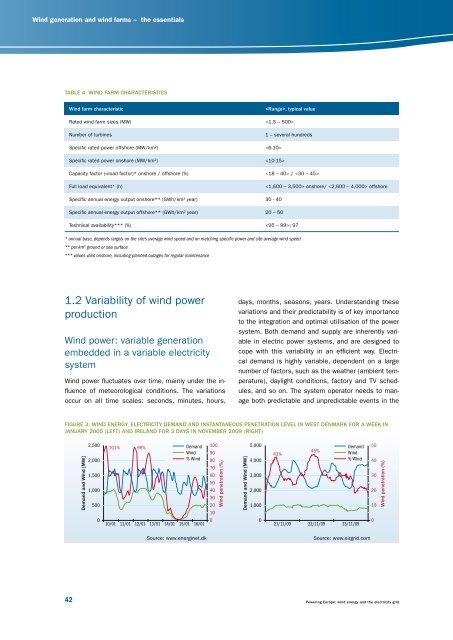
fiGURE 3: winD EnERGy, ElECtRiCity DEManD anD instantanEoUs PEnEtRation lEVEl in wEst DEnMaRk foR a wEEk in<br />
JanUaRy 2005 (lEft) anD iRElanD foR 3 Days in noVEMbER 2009 (RiGht)<br />
2,500<br />
2,000<br />
101% 98%<br />
Demand<br />
<strong>Wind</strong><br />
% <strong>Wind</strong><br />
100<br />
90<br />
80<br />
70<br />
5,000<br />
4,000<br />
43%<br />
45%<br />
Demand<br />
<strong>Wind</strong><br />
% <strong>Wind</strong><br />
1,500<br />
60<br />
50<br />
3,000<br />
1,000<br />
40<br />
30<br />
2,000<br />
500<br />
20<br />
10<br />
1,000<br />
0<br />
10/01 11/01 12/01 13/01 14/01 15/01 16/01<br />
0<br />
0<br />
21/11/09 22/11/09 23/11/09<br />
Demand and <strong>Wind</strong> [MW]<br />
Source: www.energinet.dk Source: www.eirgrid.com<br />
50<br />
40<br />
30<br />
20<br />
10<br />
<strong>Wind</strong> penetration (%)<br />
<strong>Powering</strong> <strong>Europe</strong>: wind energy and the electricity grid<br />
0


