department of defense agency financial report fiscal year 2012
department of defense agency financial report fiscal year 2012
department of defense agency financial report fiscal year 2012

You also want an ePaper? Increase the reach of your titles
YUMPU automatically turns print PDFs into web optimized ePapers that Google loves.
Department <strong>of</strong> Defense Agency Financial Report for FY <strong>2012</strong><br />
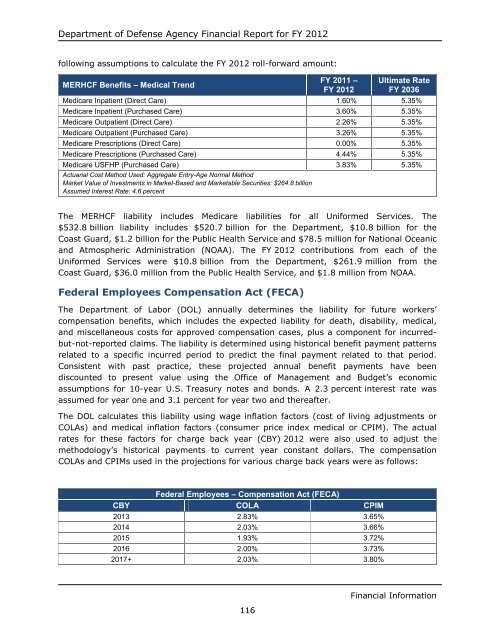
following assumptions to calculate the FY <strong>2012</strong> roll-forward amount:<br />
MERHCF Benefits – Medical Trend<br />
116<br />
FY 2011 –<br />
FY <strong>2012</strong><br />
Ultimate Rate<br />
FY 2036<br />
Medicare Inpatient (Direct Care) 1.60% 5.35%<br />
Medicare Inpatient (Purchased Care) 3.60% 5.35%<br />
Medicare Outpatient (Direct Care) 2.26% 5.35%<br />
Medicare Outpatient (Purchased Care) 3.26% 5.35%<br />
Medicare Prescriptions (Direct Care) 0.00% 5.35%<br />
Medicare Prescriptions (Purchased Care) 4.44% 5.35%<br />
Medicare USFHP (Purchased Care) 3.83% 5.35%<br />
Actuarial Cost Method Used: Aggregate Entry-Age Normal Method<br />
Market Value <strong>of</strong> Investments in Market-Based and Marketable Securities: $264.8 billion<br />
Assumed Interest Rate: 4.6 percent<br />
The MERHCF liability includes Medicare liabilities for all Uniformed Services. The<br />
$532.8 billion liability includes $520.7 billion for the Department, $10.8 billion for the<br />
Coast Guard, $1.2 billion for the Public Health Service and $78.5 million for National Oceanic<br />
and Atmospheric Administration (NOAA). The FY <strong>2012</strong> contributions from each <strong>of</strong> the<br />
Uniformed Services were $10.8 billion from the Department, $261.9 million from the<br />
Coast Guard, $36.0 million from the Public Health Service, and $1.8 million from NOAA.<br />
Federal Employees Compensation Act (FECA)<br />
The Department <strong>of</strong> Labor (DOL) annually determines the liability for future workers’<br />
compensation benefits, which includes the expected liability for death, disability, medical,<br />
and miscellaneous costs for approved compensation cases, plus a component for incurredbut-not-<strong>report</strong>ed<br />
claims. The liability is determined using historical benefit payment patterns<br />
related to a specific incurred period to predict the final payment related to that period.<br />
Consistent with past practice, these projected annual benefit payments have been<br />
discounted to present value using the Office <strong>of</strong> Management and Budget’s economic<br />
assumptions for 10-<strong>year</strong> U.S. Treasury notes and bonds. A 2.3 percent interest rate was<br />
assumed for <strong>year</strong> one and 3.1 percent for <strong>year</strong> two and thereafter.<br />
The DOL calculates this liability using wage inflation factors (cost <strong>of</strong> living adjustments or<br />
COLAs) and medical inflation factors (consumer price index medical or CPIM). The actual<br />
rates for these factors for charge back <strong>year</strong> (CBY) <strong>2012</strong> were also used to adjust the<br />
methodology’s historical payments to current <strong>year</strong> constant dollars. The compensation<br />
COLAs and CPIMs used in the projections for various charge back <strong>year</strong>s were as follows:<br />
CBY<br />
Federal Employees – Compensation Act (FECA)<br />
COLA CPIM<br />
2013 2.83% 3.65%<br />
2014 2.03% 3.66%<br />
2015 1.93% 3.72%<br />
2016 2.00% 3.73%<br />
2017+ 2.03% 3.80%<br />
Financial Information