dissertation in pdf-format - Aalto-yliopisto
dissertation in pdf-format - Aalto-yliopisto
dissertation in pdf-format - Aalto-yliopisto

Create successful ePaper yourself
Turn your PDF publications into a flip-book with our unique Google optimized e-Paper software.
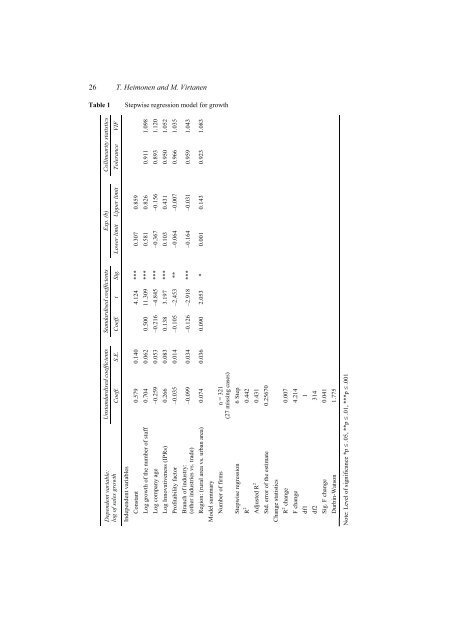
26 T. Heimonen and M. Virtanen<br />
Table 1 Stepwise regression model for growth<br />
Dependent variable:<br />
Unstandardised coefficients Standardised coefficients Exp. (b) Coll<strong>in</strong>earity statistics<br />
log of sales growth Coeff. S.E. Coeff. t Sig. Lower limit Upper limit Tolerance VIF<br />
Independent variables<br />
Constant 0.579 0.140 4.124 *** 0.307 0.859<br />
Log growth of the number of staff 0.704 0.062 0.500 11.309 *** 0.581 0.826 0.911 1.098<br />
Log company age –0.259 0.053 –0.216 –4.845 *** –0.367 –0.156 0.893 1.120<br />
Log Innovativeness (IPRs) 0.266 0.083 0.138 3.197 *** 0.103 0.431 0.950 1.052<br />
Profitability factor –0.035 0.014 –0.105 –2.453 ** –0.064 –0.007 0.966 1.035<br />
Branch of <strong>in</strong>dustry:<br />
–0.099 0.034 –0.126 –2.918 *** –0.164 –0.031 0.959 1.043<br />
(other <strong>in</strong>dustries vs. trade)<br />
Region: (rural area vs. urban area) 0.074 0.036 0.090 2.053 * 0.001 0.143 0.923 1.083<br />
Model summary<br />
Number of firms n = 321<br />
(27 miss<strong>in</strong>g cases)<br />
Stepwise regression 6 Step<br />
R 2 0.442<br />
Adjusted R 2 0.431<br />
Std. error of the estimate 0.25670<br />
Change statistics<br />
R 2 change 0.007<br />
F change 4.214<br />
df1 1<br />
df2 314<br />
Sig. F change 0.041<br />
Durb<strong>in</strong>-Watson 1.775<br />
Note: Level of significance *p .05, **p .01, ***p .001