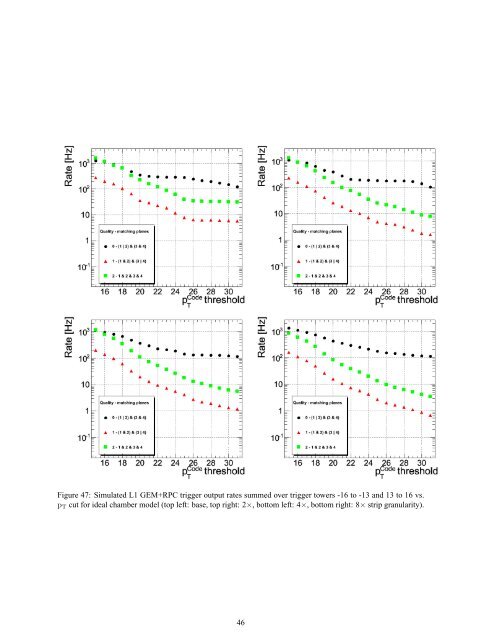
5.3 Simulated chamber properties The trigger studies were done in two stages. In <strong>the</strong> first stage, <strong>the</strong> impact <strong>of</strong> ch<strong>an</strong>ges in geometry was tested while assuming perfect chamber operation, both <strong>for</strong> <strong>GEM</strong> <strong>an</strong>d RPC chambers, i.e. no noise, no clusters (charged particle always fires exactly one strip), <strong>an</strong>d 100% chamber efficiency, i.e. <strong>the</strong> “ideal” chamber model. In <strong>the</strong> second stage, chamber effects were included in a “realistic” chamber model. Here <strong>the</strong> simulated chamber efficiency was taken as 95%, <strong>an</strong> average cluster size <strong>of</strong> two was used <strong>for</strong> RPC chambers while <strong>for</strong> <strong>the</strong> <strong>GEM</strong> chambers <strong>the</strong> clustering remained disabled. The latter choice was motivated by <strong>the</strong> assumption that <strong>the</strong> RPC trigger will not use <strong>the</strong> full <strong>GEM</strong> chamber gr<strong>an</strong>ularity. In this model, <strong>the</strong> simulation <strong>of</strong> noise still remained disabled <strong>for</strong> both types <strong>of</strong> chambers since it is hard to estimate expected noise in <strong>the</strong> <strong>GEM</strong> chambers at this point. 5.4 Results Fig. 47 <strong>an</strong>d 48 show <strong>the</strong> dependence <strong>of</strong> <strong>GEM</strong>+RPC L1 trigger output rates on <strong>the</strong> pT threshold <strong>for</strong> all simulated geometries. The shape <strong>of</strong> <strong>the</strong> single-muon input rate as function <strong>of</strong>pT is generated based on <strong>the</strong> shape in Ref. [24] <strong>an</strong>d normalised to 10 34 cm −2 s −1 luminosity. Results sum trigger rates <strong>for</strong> trigger towers -16 to -13 <strong>an</strong>d 13 to 16. The overall rate is dominated by muon c<strong>an</strong>didates with lowest quality 0. This effect is visible <strong>for</strong> all geometries; it is higher <strong>for</strong> <strong>the</strong> realistic chamber model when compared to <strong>the</strong> ideal one. This is not surprising since due to <strong>the</strong> definition <strong>of</strong> “quality” <strong>the</strong> muon c<strong>an</strong>didates with quality 0 use only one muon trigger station <strong>for</strong> momentum measurement <strong>an</strong>d do not benefit from increased spatial resolution. Consequently, only contributions from muon c<strong>an</strong>didates with qualities 1 <strong>an</strong>d 2 will be considered fur<strong>the</strong>r in our discussion. The most import<strong>an</strong>t result observed in <strong>the</strong>se plots is that <strong>the</strong> rate <strong>for</strong> muon c<strong>an</strong>didates with higher qualities 1 <strong>an</strong>d 2 flattens out above pT = 26 GeV/c <strong>for</strong> <strong>the</strong> RPC-only “base” geometry. By contrast, in <strong>the</strong> 2×, 4×, <strong>an</strong>d 8× scenarios that make use <strong>of</strong> <strong>GEM</strong> chambers, <strong>the</strong> rate continues to decrease with increasing pT threshold. This indicates that a L1 trigger upgraded with in<strong>for</strong>mation from <strong>GEM</strong> chambers allows continued use <strong>of</strong> <strong>the</strong> pT trigger threshold as a powerful tool to control muon trigger rates. We also find that <strong>the</strong> higher <strong>the</strong> strip readout gr<strong>an</strong>ularity, <strong>the</strong> lower <strong>the</strong> muon trigger rates <strong>for</strong> a givenpT threshold. Fig. 49 shows <strong>the</strong> total L1 <strong>GEM</strong>+RPC trigger output rate as a function <strong>of</strong> different geometries <strong>for</strong> different pT thresholds <strong>an</strong>d <strong>for</strong> both chamber simulation models. The contribution from muon c<strong>an</strong>didates with low quality 0 is not included here. The biggest relative improvement occurs when going from <strong>the</strong> base geometry to <strong>the</strong> 2× geometry. A fur<strong>the</strong>r increas in <strong>the</strong> number <strong>of</strong> strips lowers <strong>the</strong> rate fur<strong>the</strong>r, but <strong>the</strong> relative improvement is smaller due to a non-linear dependence. The number <strong>of</strong> trigger patterns grows with <strong>the</strong> number <strong>of</strong> strips used. Since <strong>the</strong> existing PAC chips have limited capacity, a full upgrade <strong>of</strong> <strong>the</strong> PAC system, in <strong>the</strong> future, could match <strong>the</strong> <strong>GEM</strong> installation schedule in such a way that it exploits <strong>the</strong> capabilities <strong>of</strong> <strong>the</strong> combined system. Fig. 50-53 show <strong>the</strong> simulated trigger turn-on curves <strong>for</strong> trigger tower 13 3) , i.e. <strong>the</strong> L1 trigger efficiencies <strong>for</strong> all geometry variations <strong>an</strong>d <strong>for</strong> three different pT thresholds (16, 50, <strong>an</strong>d 140 GeV c ) as a function <strong>of</strong> <strong>the</strong> true muon tr<strong>an</strong>sverse momentum. The efficiency curves get worse in general <strong>for</strong> higher tower numbers due to <strong>the</strong> decreasing bending power <strong>of</strong> <strong>the</strong> magnetic field. The turn-on curves become much sharper as <strong>the</strong> <strong>GEM</strong> strip gr<strong>an</strong>ularity increases. The higher <strong>the</strong> pT threshold, <strong>the</strong> more dramatic <strong>the</strong> effect. For inst<strong>an</strong>ce, with a 140 GeV c threshold, <strong>the</strong> current “base” RPC trigger accepts typically over 80% <strong>of</strong> all muons with a momentum <strong>of</strong> just 60 GeV c or higher, i.e. <strong>the</strong> RPC trigger rejection with this high threshold is actually very ineffective. This is because <strong>the</strong> current RPC pattern trigger has difficulties distinguishing <strong>the</strong> momenta <strong>of</strong> very straight tracks from each o<strong>the</strong>r due to its coarse gr<strong>an</strong>ularity. For <strong>the</strong> 8× <strong>GEM</strong>+RPC geometry, this 80% point with a 140 GeV making <strong>the</strong> L1 trigger rejection much more effective. c threshold moves up to 120-140 GeV c From <strong>the</strong>se first simulation studies we conclude that <strong>the</strong> <strong>GEM</strong> detector stations would signific<strong>an</strong>tly improve <strong>the</strong> L1 muon trigger per<strong>for</strong>m<strong>an</strong>ce over that <strong>of</strong> <strong>the</strong> originally pl<strong>an</strong>ned RPC-only system in <strong>the</strong> <strong>for</strong>ward direction|η| > 1.6. 3) Results <strong>for</strong> trigger towers 14-16 c<strong>an</strong> be found in appendix D 45
Figure 47: Simulated L1 <strong>GEM</strong>+RPC trigger output rates summed over trigger towers -16 to -13 <strong>an</strong>d 13 to 16 vs. pT cut <strong>for</strong> ideal chamber model (top left: base, top right: 2×, bottom left: 4×, bottom right: 8× strip gr<strong>an</strong>ularity). 46