A GEM Detector System for an Upgrade of the CMS Muon Endcaps
A GEM Detector System for an Upgrade of the CMS Muon Endcaps
A GEM Detector System for an Upgrade of the CMS Muon Endcaps

Create successful ePaper yourself
Turn your PDF publications into a flip-book with our unique Google optimized e-Paper software.
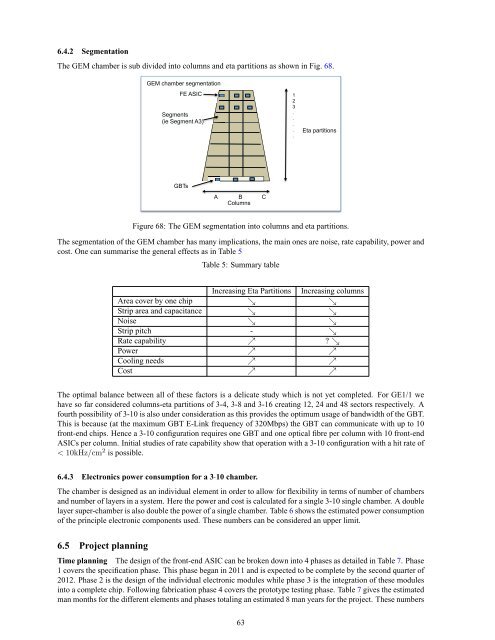
6.4.2 Segmentation<br />
The <strong>GEM</strong> chamber is sub divided into columns <strong>an</strong>d eta partitions as shown in Fig. 68.<br />
<strong>GEM</strong> chamber segmentation<br />
FE ASIC C<br />
Segments<br />
(ie Segment A3) 3)<br />
GBTs<br />
A B C<br />
Columns<br />
1<br />
2<br />
3<br />
.<br />
.<br />
.<br />
.<br />
.<br />
Eta partitions<br />
Figure 68: The <strong>GEM</strong> segmentation into columns <strong>an</strong>d eta partitions.<br />
The segmentation <strong>of</strong> <strong>the</strong> <strong>GEM</strong> chamber has m<strong>an</strong>y implications, <strong>the</strong> main ones are noise, rate capability, power <strong>an</strong>d<br />
cost. One c<strong>an</strong> summarise <strong>the</strong> general effects as in Table 5<br />
Table 5: Summary table<br />
Increasing Eta Partitions Increasing columns<br />
Area cover by one chip ց ց<br />
Strip area <strong>an</strong>d capacit<strong>an</strong>ce ց ց<br />
Noise ց ց<br />
Strip pitch - ց<br />
Rate capability ր ? ց<br />
Power ր ր<br />
Cooling needs ր ր<br />
Cost ր ր<br />
The optimal bal<strong>an</strong>ce between all <strong>of</strong> <strong>the</strong>se factors is a delicate study which is not yet completed. For GE1/1 we<br />
have so far considered columns-eta partitions <strong>of</strong> 3-4, 3-8 <strong>an</strong>d 3-16 creating 12, 24 <strong>an</strong>d 48 sectors respectively. A<br />
fourth possibility <strong>of</strong> 3-10 is also under consideration as this provides <strong>the</strong> optimum usage <strong>of</strong> b<strong>an</strong>dwidth <strong>of</strong> <strong>the</strong> GBT.<br />
This is because (at <strong>the</strong> maximum GBT E-Link frequency <strong>of</strong> 320Mbps) <strong>the</strong> GBT c<strong>an</strong> communicate with up to 10<br />
front-end chips. Hence a 3-10 configuration requires one GBT <strong>an</strong>d one optical fibre per column with 10 front-end<br />
ASICs per column. Initial studies <strong>of</strong> rate capability show that operation with a 3-10 configuration with a hit rate <strong>of</strong><br />
< 10kHz/cm 2 is possible.<br />
6.4.3 Electronics power consumption <strong>for</strong> a 3·10 chamber.<br />
The chamber is designed as <strong>an</strong> individual element in order to allow <strong>for</strong> flexibility in terms <strong>of</strong> number <strong>of</strong> chambers<br />
<strong>an</strong>d number <strong>of</strong> layers in a system. Here <strong>the</strong> power <strong>an</strong>d cost is calculated <strong>for</strong> a single 3-10 single chamber. A double<br />
layer super-chamber is also double <strong>the</strong> power <strong>of</strong> a single chamber. Table 6 shows <strong>the</strong> estimated power consumption<br />
<strong>of</strong> <strong>the</strong> principle electronic components used. These numbers c<strong>an</strong> be considered <strong>an</strong> upper limit.<br />
6.5 Project pl<strong>an</strong>ning<br />
Time pl<strong>an</strong>ning The design <strong>of</strong> <strong>the</strong> front-end ASIC c<strong>an</strong> be broken down into 4 phases as detailed in Table 7. Phase<br />
1 covers <strong>the</strong> specification phase. This phase beg<strong>an</strong> in 2011 <strong>an</strong>d is expected to be complete by <strong>the</strong> second quarter <strong>of</strong><br />
2012. Phase 2 is <strong>the</strong> design <strong>of</strong> <strong>the</strong> individual electronic modules while phase 3 is <strong>the</strong> integration <strong>of</strong> <strong>the</strong>se modules<br />
into a complete chip. Following fabrication phase 4 covers <strong>the</strong> prototype testing phase. Table 7 gives <strong>the</strong> estimated<br />
m<strong>an</strong> months <strong>for</strong> <strong>the</strong> different elements <strong>an</strong>d phases totaling <strong>an</strong> estimated 8 m<strong>an</strong> years <strong>for</strong> <strong>the</strong> project. These numbers<br />
63