Protocols for Secure Communication in Wireless Sensor Networks
Protocols for Secure Communication in Wireless Sensor Networks
Protocols for Secure Communication in Wireless Sensor Networks

Create successful ePaper yourself
Turn your PDF publications into a flip-book with our unique Google optimized e-Paper software.
148 Chapter 5. Multipath <strong>Communication</strong><br />
5.3.4 Delivery Rate<br />
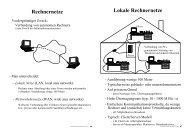
Figure 5.11: Distribution of out-degree<br />
As discussed above, the convex hull created from the cover areas of a set of<br />
nodes may conta<strong>in</strong> locations that are actually not <strong>in</strong> the cover area of any of<br />
these nodes. Thus, a message may be routed to a subtree that does not conta<strong>in</strong><br />
any node cover<strong>in</strong>g the target location of the message. The delivery rate depends<br />
on the topology of the network and the cover density, i.e. the number of nodes<br />
whose cover area conta<strong>in</strong>s a certa<strong>in</strong> location.<br />
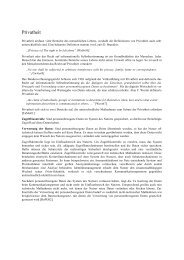
Figure 5.12 shows the <strong>in</strong>crease of the delivery rate when the cover area of<br />
s<strong>in</strong>gle node is <strong>in</strong>creased. It seems clear that a nearly full delivery rate, <strong>for</strong><br />
example r > 0.99, cannot be achieved practically. The reason is that this would<br />
require a cover area per node that is very large compared to the size of the<br />
deployment area. For high precision of results, and low resource usage, it is<br />
best to keep the cover area small.<br />
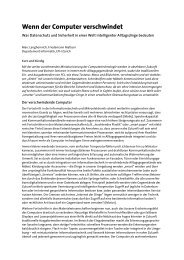
An <strong>in</strong>crease node density d, which denotes the average number of neighbours<br />
of each node, leads to a larger number of subtrees <strong>in</strong> each node as the<br />
tree construction favours shallow trees. This causes the available cover nodes<br />
to be distributed among a larger number of subtrees, thereby reduc<strong>in</strong>g the probability<br />
that a cover node is conta<strong>in</strong>ed <strong>in</strong> a subtree.<br />
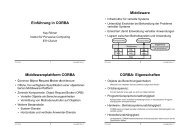
Figure 5.13 shows that an <strong>in</strong>creased cover density has the same effect on<br />
graphs whose topology is determ<strong>in</strong>ed by the Gabriel graph. However, us<strong>in</strong>g<br />
the Gabriel construction, the topology is <strong>in</strong>variant to changes <strong>in</strong> node density.<br />
There<strong>for</strong>e, node density shows little to no effect <strong>in</strong> the simulation results.