GTP 2.0 - Prime Minister's Office of Malaysia
GTP 2.0 - Prime Minister's Office of Malaysia
GTP 2.0 - Prime Minister's Office of Malaysia

Create successful ePaper yourself
Turn your PDF publications into a flip-book with our unique Google optimized e-Paper software.
NatIoNal kEy PERFoRmaNCE<br />
INDICatoRs (NkPIs)<br />
Statistics from 2012 showed a significant rise<br />
in the number <strong>of</strong> commuters opting for public<br />
transport over the use <strong>of</strong> private vehicles,<br />
which is a sign <strong>of</strong> success <strong>of</strong> the initiatives<br />
implemented by the UPT NKRA in the first two<br />
years <strong>of</strong> the <strong>GTP</strong>. But despite these positive<br />
results, the UPT NKRA has not achieved its target<br />
<strong>of</strong> attaining 25% public transport modal share<br />
for 2012.<br />
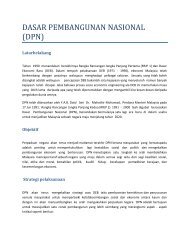
Public transport ridership increased by<br />
80,000 passengers per day in 2012 but the<br />
gains in ridership were <strong>of</strong>fset by the faster<br />
growth <strong>of</strong> private vehicle use. Data indicates that<br />
public ridership grew to 930,468 trips in 2012<br />
from 622,185 trips in the previous year. However,<br />
the number <strong>of</strong> private trips grew to 4.35 million<br />
from 3.5 million over the same period.<br />
Though there has been an increase in<br />
public transport ridership, its modal share has<br />
not grown much from 17% in 2010.<br />
PUBLIC TRANSPORT RIDERSHIP<br />
VS PRIVATE VEHICLES 2011 – 2012<br />
6,000,000<br />
5,000,000<br />
4,000,000<br />
3,000,000<br />
2,000,000<br />
1,000,000<br />
0<br />
Sources: URUSBUDI,Operators, JPJ<br />
2011 2012<br />
23%<br />
Private Trips<br />
4%<br />
Public Transport<br />
Ridership<br />
three factors contribute to the speedier growth <strong>of</strong><br />
private vehicle use:<br />
Faster growth <strong>of</strong> private vehicle ownership – about<br />
10,000 cars every two weeks – owing to affordable fuel<br />
and vehicle costs.<br />
Reluctance <strong>of</strong> private vehicle owners to switch to<br />
public transport owing to a lack <strong>of</strong> awareness or poor<br />
accessibility, connectivity and reliability.<br />
The growth <strong>of</strong> rail, the only alternative to road transport<br />
in Kuala Lumpur, has not kept pace with the growth <strong>of</strong><br />
roads as rail is not as pr<strong>of</strong>itable.<br />
The preference <strong>of</strong> commuters to own and<br />
drive their own vehicles rather than make the<br />
switch to public transport has hampered the<br />
efforts <strong>of</strong> the UPT NKRA team to boost public<br />
transport modal share. However, as the KPI<br />
table on the next page shows, the UPT NKRA<br />
managed to achieve all its capacity goals as well<br />
as increase consumer satisfaction despite<br />
missing its modal share targets.<br />
The aim in <strong>GTP</strong> <strong>2.0</strong> is to further enhance<br />
“pull factors” to encourage commuters to<br />
make the switch, while “push factors”–i.e.,<br />
discouraging the use <strong>of</strong> the use <strong>of</strong><br />
private vehicles–are being considered for<br />
implementation as well.<br />
The combination <strong>of</strong> both push and pull is<br />
expected to improve public transport modal<br />
share over the next three years.<br />
1<br />
2<br />
3<br />
4<br />
5<br />
6<br />
7<br />
8<br />
9<br />
KPI<br />
Modal Share<br />
Ridership <strong>of</strong><br />
public transport<br />
(per day A.M. peak)<br />
Population living<br />
within 400m <strong>of</strong> public<br />
transport route<br />
KTM Komuter peak<br />
load factor<br />
RapidKL LRT KJ line<br />
peak load factor<br />
Bus peak load factor<br />
Passenger satisfaction<br />
Weighted average ratio<br />
<strong>of</strong> public journey time to<br />
private journey time<br />
Road safety (deaths<br />
per 10,000 vehicles)<br />
UPT NKRA / NKPI<br />
Actual<br />
Achievement<br />
Target 2012 Results<br />
25%<br />
600,000<br />
72%<br />
100%<br />
80%<br />
70%<br />
55%<br />
1.60 : 1<br />
3.01<br />
* Achievement<br />
is the average <strong>of</strong><br />
monthly return<br />
from Jan – Oct<br />
20%<br />
334,598<br />
72%<br />
53%<br />
83%<br />
87%<br />
73%<br />
1.43 : 1<br />
2.8<br />
80%<br />
56%<br />
100%<br />
189%<br />
96%<br />
124%<br />
133%<br />
112%<br />
108%<br />
Overall 111%<br />
90% Above<br />
Achievement <strong>of</strong> 90% and above<br />
51 % to 89%<br />
Achievement <strong>of</strong> 51% to 89%<br />
170 Government transformation Programme—Annual Report 2012 Chapter Nine 171<br />
Government transformation Programme—Annual Report 2012 Chapter Nine