Aalborg Universitet Bike Infrastructures Report Silva, Victor ... - VBN
Aalborg Universitet Bike Infrastructures Report Silva, Victor ... - VBN
Aalborg Universitet Bike Infrastructures Report Silva, Victor ... - VBN
You also want an ePaper? Increase the reach of your titles
YUMPU automatically turns print PDFs into web optimized ePapers that Google loves.
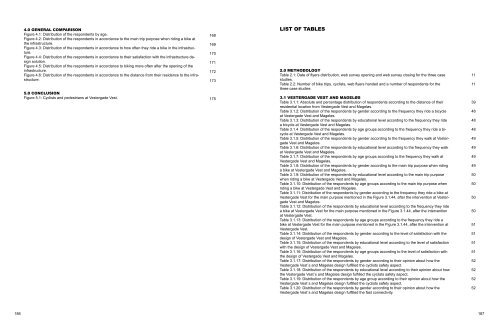
4.0 GENERAL COMPARISON<br />
Figure 4.1: Distribution of the respondents by age.<br />
Figure 4.2: Distribution of the respondents in accordance to the main trip purpose when riding a bike at<br />
the infrastructure.<br />
Figure 4.3: Distribution of the respondents in accordance to how often they ride a bike in the infrastructure.<br />
Figure 4.4: Distribution of the respondents in accordance to their satisfaction with the infrastructure design<br />
solution.<br />
Figure 4.5: Distribution of the respondents in accordance to biking more often after the opening of the<br />
infrastructure.<br />
Figure 4.6: Distribution of the respondents in accordance to the distance from their residence to the infrastructure.<br />
5.0 CONCLUSION<br />
Figure 5.1: Cyclists and pedestrians at Vestergade Vest.<br />
168<br />
169<br />
170<br />
171<br />
172<br />
173<br />
175<br />
LIST OF tables<br />
2.0 METHODOLOGY<br />
Table 2.1: Date of flyers distribution, web survey opening and web survey closing for the three case<br />
studies.<br />
Table 2.2: Number of bike trips, cyclists, web flyers handed and a number of respondents for the<br />
three case studies<br />
3.1 VESTERGADE VEST AND MAGELØS<br />
Table 3.1.1: Absolute and percentage distribution of respondents according to the distance of their<br />
residential location from Vestergade Vest and Mageløs.<br />
Table 3.1.2: Distribution of the respondents by gender according to the frequency they ride a bicycle<br />
at Vestergade Vest and Mageløs.<br />
Table 3.1.3: Distribution of the respondents by educational level according to the frequency they ride<br />
a bicycle at Vestergade Vest and Mageløs.<br />
Table 3.1.4 Distribution of the respondents by age groups according to the frequency they ride a bicycle<br />
at Vestergade Vest and Mageløs.<br />
Table 3.1.5: Distribution of the respondents by gender according to the frequency they walk at Vestergade<br />
Vest and Mageløs.<br />
Table 3.1.6: Distribution of the respondents by educational level according to the frequency they walk<br />
at Vestergede Vest and Mageløs.<br />
Table 3.1.7: Distribution of the respondents by age groups according to the frequency they walk at<br />
Vestergade Vest and Mageløs.<br />
Table 3.1.8: Distribution of the respondents by gender according to the main trip purpose when riding<br />
a bike at Vestergade Vest and Mageløs.<br />
Table 3.1.9: Distribution of the respondents by educational level according to the main trip purpose<br />
when riding a bike at Vestergade Vest and Mageløs.<br />
Table 3.1.10: Distribution of the respondents by age groups according to the main trip purpose when<br />
riding a bike at Vestergade Vest and Mageløs.<br />
Table 3.1.11: Distribution of the respondents by gender according to the frequency they ride a bike at<br />
Vestergade Vest for the main purpose mentioned in the Figure 3.1.44, after the intervention at Vestergade<br />
Vest and Mageløs.<br />
Table 3.1.12: Distribution of the respondents by educational level according to the frequency they ride<br />
a bike at Vestergade Vest for the main purpose mentioned in the Figure 3.1.44, after the intervention<br />
at Vestergade Vest.<br />
Table 3.1.13: Distribution of the respondents by age groups according to the frequency they ride a<br />
bike at Vestergade Vest for the main purpose mentioned in the Figure 3.1.44, after the intervention at<br />
Vestergade Vest.<br />
Table 3.1.14: Distribution of the respondents by gender according to the level of satisfaction with the<br />
design of Vestergade Vest and Mageløs.<br />
Table 3.1.15: Distribution of the respondents by educational level according to the level of satisfaction<br />
with the design of Vestergade Vest and Mageløs.<br />
Table 3.1.16: Distribution of the respondents by age groups according to the level of satisfaction with<br />
the design of Vestergade Vest and Mageløs.<br />
Table 3.1.17: Distribution of the respondents by gender according to their opinion about how the<br />
Vestergade Vest`s and Mageløs design fulfilled the cyclists safety aspect.<br />
Table 3.1.18: Distribution of the respondents by educational level according to their opinion about how<br />
the Vestergade Vest`s and Mageløs design fulfilled the cyclists safety aspect.<br />
Table 3.1.19: Distribution of the respondents by age group according to their opinion about how the<br />
Vestergade Vest`s and Mageløs design fulfilled the cyclists safety aspect.<br />
Table 3.1.20: Distribution of the respondents by gender according to their opinion about how the<br />
Vestergade Vest`s and Mageløs design fulfilled the fast connectivity.<br />
11<br />
11<br />
39<br />
48<br />
48<br />
48<br />
49<br />
49<br />
49<br />
49<br />
50<br />
50<br />
50<br />
50<br />
51<br />
51<br />
51<br />
51<br />
52<br />
52<br />
52<br />
52<br />
186 187


