

Aalborg Universitet Bike Infrastructures Report Silva, Victor ... - VBN
Aalborg Universitet Bike Infrastructures Report Silva, Victor ... - VBN
Aalborg Universitet Bike Infrastructures Report Silva, Victor ... - VBN

You also want an ePaper? Increase the reach of your titles
YUMPU automatically turns print PDFs into web optimized ePapers that Google loves.
DESCRIPTIVE STATISTICS<br />
AGE<br />
35%<br />
AGE<br />
EDUCATION LEVEL<br />
50%<br />
EDUCATION LEVEL<br />
HOW OFTEN DO YOU GO ON BRYGGEBROEN WITHOUT<br />
WALKING AT BRYGGEBRO BIKE?<br />
70%<br />
HOW OFTEN DO YOU USE THE BIKE FOR THE PURPOSE<br />
IN THE PREVIUS QUESTION AFTER THE OPENING OF<br />
FREQUENCY OF BRYGGEBROEN?<br />
TRIPS TO THE MAIN PURPOSE<br />
1% 1% 1%<br />
56%<br />
30%<br />
25%<br />
20%<br />
15%<br />
10%<br />
5%<br />
45%<br />
40%<br />
35%<br />
30%<br />
25%<br />
20%<br />
15%<br />
10%<br />
5%<br />
60%<br />
50%<br />
40%<br />
30%<br />
20%<br />
10%<br />
28%<br />
13%<br />
No answer<br />
More rarely<br />
Not as often<br />
Just as often as before<br />
More often<br />
Much more often<br />
0%<br />
NO<br />
ANSWER<br />
00 - 10<br />
YEARS<br />
11 - 20<br />
YEARS<br />
21 - 30<br />
YEARS<br />
31 - 40<br />
YEARS<br />
Figure 3.3.63: Distribution of the respondents by age groups.<br />
41 - 50<br />
YEARS<br />
51 - 60<br />
YEARS<br />
61 - 70<br />
YEARS<br />
0%<br />
NO ANSWER<br />
PUBLIC<br />
SCHOOL<br />
VOCATIONAL<br />
EDUCATION<br />
HIGH<br />
SCHOOL<br />
SHORT<br />
HIGHER<br />
EDUCATION<br />
Figure 3.3.65: Distribution of the respondents by educational level.<br />
MEDIUM<br />
HIGHER<br />
EDUCATION<br />
LONG<br />
HIGHER<br />
EDUCATION<br />
0%<br />
NO ANSWER 6-7 DAYS OF<br />
WEEK<br />
5 DAYS OF<br />
WEEK<br />
3-4 DAYS OF<br />
WEEK<br />
1-2 DAYS OF 1-3 DAYS OF<br />
WEEK MONTHS<br />
MORE<br />
RARELY<br />
Figure 3.3.67: Distribution of the respondents by the frequency they walk at Bryggebro.<br />
Figure 3.3.69: Distribution of the respondents by the frequency they ride a bike in<br />
Bryggebro for the main purpose mentioned in the Figure 3.3.68 after Bryggebro’s<br />
opening.<br />
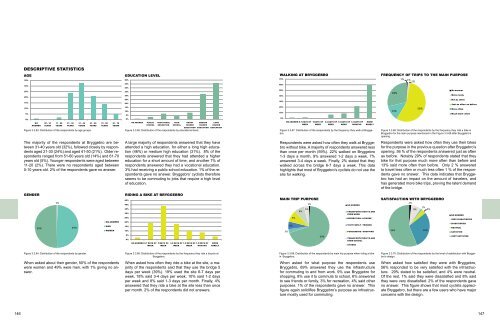
The majority of the respondents at Bryggebro are between<br />
31-40 years old (32%), followed closely by respondents<br />
aged 21-30 (24%) and aged 41-50 (21%). Older respondents<br />
ranged from 51-60 years old (14%) and 61-70<br />
years old (5%). Younger respondents were aged between<br />
11-20 (2%). There were no respondents aged between<br />
0-10 years old. 2% of the respondents gave no answer.<br />
A large majority of respondents answered that they have<br />
attended a high education, for either a long high education<br />
(46%) or medium high education (31%). 8% of the<br />
respondents answered that they had attended a higher<br />
education for a short amount of time, and another 7% of<br />
respondents answered they had a vocational education.<br />
3% had receiving a public school education. 1% of the respondents<br />
gave no answer. Bryggebro’ cyclists therefore<br />
seems to be commuting to jobs that require a high level<br />
of education.<br />
Respondents were asked how often they walk at Bryggebro<br />
without bike. A majority of respondents answered less<br />
than once per month (59%). 22% walked on Bryggebro<br />
1-3 days a month, 9% answered 1-2 days a week, 7%<br />
answered 3-4 days a week. Finally, 2% stated that they<br />
walked across the bridge 6-7 days a week. This data<br />
highlights that most of Bryggebro’s cyclists do not use the<br />
site for walking.<br />
Respondents were asked how often they use their bikes<br />
for the purpose in the previous question after Bryggebro’s<br />
opening. 56 % of the respondents answered just as often<br />
as before. Notably 29% of respondents stated that they<br />
bike for that purpose much more often than before and<br />
13% said more often than before. Only 2 % answered<br />
to travel less often or much less often 1 % of the respondents<br />
gave no answer. This data indicates that Bryggebro<br />
has had an impact on the amount of travelers, and<br />
has generated more bike trips, proving the latent demand<br />
of the bridge. .<br />
GENDER<br />
1%<br />
GENDER<br />
RIDING A BIKE AT BRYGGEBRO<br />
45%<br />
40%<br />
HOW OFTEN DO YOU BIKE ON BRYGGEBROEN?<br />
WHAT IS YOUR PURPOSE ON BRYGGEBROEN?<br />
MAIN TRIP PURPOSE<br />
1%<br />
NO ANSWER<br />
HOW SATISFIED ARE YOU WITH BRYGGEBROEN?<br />
SATISFACTION WITH BRYGGEBRO<br />
2%<br />
50%<br />
49%<br />
NO ANSWER<br />
MAN<br />
WOMEN<br />
35%<br />
30%<br />
25%<br />
20%<br />
15%<br />
10%<br />
3%<br />
6%<br />
9%<br />
8% 4%<br />
TRANSPORTATION TO AND<br />
FROM WORK<br />
RECREATION / LEISURE<br />
VISIT FAMILY / FRIENDS<br />
PURCHASING / SHOPPING<br />
56%<br />
8%<br />
1% 4%<br />
29%<br />
NO ANSWER<br />
VERY DISSATISFIED<br />
DISSATISFIED<br />
NEUTRAL<br />
SATISFIED<br />
5%<br />
0%<br />
NO ANSWER 6-7 DAYS OF<br />
WEEK<br />
5 DAYS OF<br />
WEEK<br />
3-4 DAYS OF<br />
WEEK<br />
1-2 DAYS OF 1-3 DAYS OF<br />
WEEK MONTHS<br />
MORE<br />
RARELY<br />
69%<br />
TRANSPORTATION TO AND<br />
FROM SCHOOL<br />
OTHERS<br />
VERY SATISFIED<br />
Figure 3.3.64: Distribution of the respondents by gender.<br />
Figure 3.3.66: Distribution of the respondents by the frequency they ride a bicycle at<br />
Bryggebro.<br />
Figure 3.3.68: Distribution of the respondents by main trip purpose when riding a bike<br />
in Bryggebro.<br />
Figure 3.3.70: Distribution of the respondents by the level of satisfaction with Bryggebro’s<br />
design.<br />
When asked about their gender, 50% of the respondents<br />
were women and 49% were men, with 1% giving no answer.<br />
When asked how often they ride a bike at the site, a majority<br />
of the respondents said that they use the bridge 5<br />
days per week (39%). 19% used the site 6-7 days per<br />
week, 18% said 3-4 days per week, 10% said 1-2 days<br />
per week and 8% said 1-3 days per month. Finally, 4%<br />
answered that they ride a bike at the site less than once<br />
per month. 2% of the respondents did not answers.<br />
When asked for what purpose the respondents use<br />
Bryggebro, 69% answered they use the infrastructure<br />
for commuting to and from work. 9% use Bryggebro for<br />
shopping, 8% use it to commute to school, 6% answered<br />
to see friends or family, 3% for recreation, 4% said other<br />
purposes. 1% of the respondents gave no answer. This<br />
figure again solidifies Bryggebro’s purpose as infrastructure<br />
mostly used for commuting.<br />
When asked how satisfied they were with Bryggebro,<br />
56% responded to be very satisfied with the infrastructure.<br />
29% stated to be satisfied, and 4% were neutral.<br />
Of the rest, 1% said they were dissatisfied and 8% said<br />
they were very dissatisfied. 2% of the respondents gave<br />
no answer. This figure shows that most cyclists appreciate<br />
Bryggebro, but there are a few users who have major<br />
concerns with the design.<br />
146 147


