

Aalborg Universitet Bike Infrastructures Report Silva, Victor ... - VBN
Aalborg Universitet Bike Infrastructures Report Silva, Victor ... - VBN
Aalborg Universitet Bike Infrastructures Report Silva, Victor ... - VBN

You also want an ePaper? Increase the reach of your titles
YUMPU automatically turns print PDFs into web optimized ePapers that Google loves.
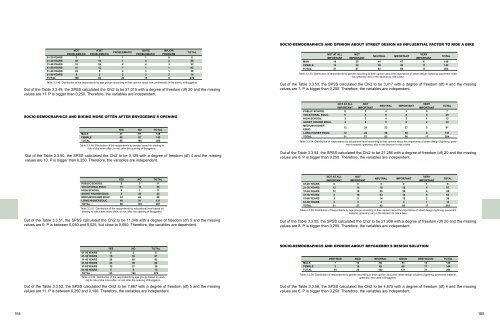
SOCIO-DEMOGRAPHICS AND OPINION ABOUT STREET DESIGN AS INFLUENTIAL FACTOR TO RIDE A BIKE<br />
NOT<br />
A BIT<br />
QUITE<br />
MAJOR<br />
PROBLEMATIC<br />
PROBLEMATIC PROBLEMATIC<br />
PROBLEMATIC PROBLEM<br />
TOTAL<br />
01-20 YEARS 3 1 1 1 0 6<br />
21-30 YEARS 40 19 1 4 2 66<br />
31-40 YEARS 53 24 8 4 3 92<br />
41-50 YEARS 41 12 7 1 1 62<br />
51-60 YEARS 23 8 4 3 1 39<br />
61-90 YEARS 6 2 2 2 2 14<br />
TOTAL 166 66 23 15 9 279<br />
Table 3.3.49: Distribution of the respondents by age groups according to their opinion about how problematic is the scenic at Bryggebro.<br />
Out of the Table 3.3.49, the SPSS calculated the Chi2 to be 21,015 with a degree of freedom (df) 20 and the missing<br />
values are 11. P is bigger than 0,250. Therefore, the variables are independent.<br />
NOT AT ALL NOT<br />
VERY<br />
NEUTRAL IMPORTANT<br />
IMPORTANT IMPORTANT<br />
IMPORTANT<br />
TOTAL<br />
MAN 18 25 44 47 6 140<br />
FEMALE 13 32 39 48 11 143<br />
TOTAL 31 57 83 95 17 283<br />
Table 3.3.53: Distribution of respondents by gender according to their opinion about the importance of street design (lightning, pavement material,<br />
greenery, etc) in the decision to ride a bike.<br />
Out of the Table 3.3.53, the SPSS calculated the Chi2 to be 3,417 with a degree of freedom (df) 4 and the missing<br />
values are 7. P is bigger than 0,250. Therefore, the variables are independent.<br />
SOCIO-DEMOGRAPHICS AND BIKING MORE OFTEN AFTER BRYGGEBRO`S OPENING<br />
YES NO TOTAL<br />
MALE 41 97 138<br />
FEMALE 45 97 142<br />
TOTAL 86 194 280<br />
Table 3.3.50: Distribution of the respondents by gender based on starting to<br />
ride a bike more often, or not, after the opening of Bryggebro.<br />
Out of the Table 3.3.50, the SPSS calculated the Chi2 to be 0,129 with a degree of freedom (df) 4 and the missing<br />
values are 10. P is bigger than 0,250. Therefore, the variables are independent.<br />
NOT AT ALL NOT<br />
VERY<br />
NEUTRAL IMPORTANT<br />
IMPORTANT IMPORTANT<br />
IMPORTANT<br />
TOTAL<br />
PUBLIC SCHOOL 0 0 4 3 0 7<br />
VOCATIONAL EDUC. 0 3 9 8 0 20<br />
HIGH SCHOOL 3 2 4 2 1 12<br />
SHORT HIGHER EDUC. 4 6 5 6 2 23<br />
MEDIUM HIGHER<br />
EDUC.<br />
12 24 23 27 5 91<br />
LONG HIGHER EDUC. 12 22 38 50 9 131<br />
TOTAL 31 57 83 96 17 284<br />
Table 3.3.54: Distribution of respondents by educational level according to their opinion about the importance of street design (lightning, pavement<br />
material, greenery, etc) in the decision to ride a bike.<br />
Out of the Table 3.3.54, the SPSS calculated the Chi2 to be 21,286 with a degree of freedom (df) 20 and the missing<br />
values are 6. P is bigger than 0,250. Therefore, the variables are independent.<br />
YES NO TOTAL<br />
PUBLIC SCHOOL 5 3 8<br />
VOCATIONAL EDUC. 10 10 20<br />
HIGH SCHOOL 4 7 11<br />
SHORT HIGHER EDUC. 3 20 23<br />
MEDIUM HIGHER EDUC. 24 64 88<br />
LONG HIGHER EDUC. 40 91 131<br />
TOTAL 86 195 281<br />
Table 3.3.51: Distribution of the respondents by educational level based on<br />
starting to ride a bike more often, or not, after the opening of Bryggebro.<br />
Out of the Table 3.3.51, the SPSS calculated the Chi2 to be 11,346 with a degree of freedom (df) 5 and the missing<br />
values are 9. P is between 0,050 and 0,025, but close to 0,050. Therefore, the variables are dependent.<br />
NOT AT ALL<br />
NOT<br />
VERY<br />
NEUTRAL IMPORTANT<br />
IMPORTANT IMPORTANT<br />
IMPORTANT<br />
TOTAL<br />
01-20 YEARS 0 0 3 2 1 6<br />
21-30 YEARS 12 14 18 19 4 67<br />
31-40 YEARS 12 19 20 39 4 94<br />
41-50 YEARS 2 16 23 16 5 62<br />
51-60 YEARS 3 5 14 15 2 39<br />
61-90 YEARS 2 3 4 4 1 14<br />
TOTAL 31 57 82 95 17 282<br />
Table 3.3.55: Distribution of respondents by age groups according to their opinion about the importance of street design (lightning, pavement<br />
material, greenery, etc) in the decision to ride a bike.<br />
Out of the Table 3.3.55, the SPSS calculated the Chi2 to be 21,908 with a degree of freedom (df) 20 and the missing<br />
values are 8. P is bigger than 0,250. Therefore, the variables are independent.<br />
YES NO TOTAL<br />
01-20 YEARS 4 2 6<br />
21-30 YEARS 15 52 67<br />
31-40 YEARS 26 66 92<br />
41-50 YEARS 23 39 62<br />
51-60 YEARS 12 27 39<br />
61-90 YEARS 5 8 13<br />
TOTAL 85 194 279<br />
Table 3.3.52: Distribution of the respondents by age groups based on starting<br />
to ride a bike more often, or not, after the opening of Bryggebro.<br />
Out of the Table 3.3.52, the SPSS calculated the Chi2 to be 7,667 with a degree of freedom (df) 5 and the missing<br />
values are 11. P is between 0,250 and 0,100. Therefore, the variables are independent.<br />
SOCIO-DEMOGRAPHICS AND OPINION ABOUT BRYGGEBRO`S DESIGN SOLUTION<br />
VERY BAD BAD NEUTRAL GOOD VERY GOOD TOTAL<br />
MALE 7 10 56 53 14 140<br />
FEMALE 3 10 49 68 17 144<br />
TOTAL 10 20 102 121 31 284<br />
Table 3.3.56: Distribution of respondents by gender according to their opinion about the street design solutions (lightning, pavement material,<br />
greenery, etc) used in Bryggebro.<br />
Out of the Table 3.3.56, the SPSS calculated the Chi2 to be 4,675 with a degree of freedom (df) 4 and the missing<br />
values are 6. P is bigger than 0,250. Therefore, the variables are independent.<br />
164 165


