

Aalborg Universitet Bike Infrastructures Report Silva, Victor ... - VBN
Aalborg Universitet Bike Infrastructures Report Silva, Victor ... - VBN
Aalborg Universitet Bike Infrastructures Report Silva, Victor ... - VBN

Create successful ePaper yourself
Turn your PDF publications into a flip-book with our unique Google optimized e-Paper software.
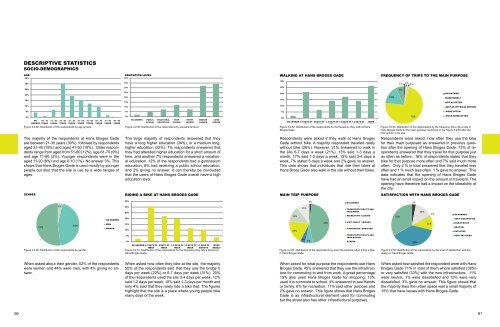
DESCRIPTIVE STATISTICS<br />
SOCIO-DEMOGRAPHICS<br />
AGE<br />
35%<br />
30%<br />
AGE<br />
EDUCATION LEVEL<br />
40%<br />
35%<br />
EDUCATION LEVEL<br />
HOW OFTEN DO YOU GO ON HANS BROGES GADE<br />
WALKING AT HANS BROGES WITHOUT BIKE? GADE<br />
30%<br />
HOW OFTEN DO YOU USE THE BIK E FOR THE PURPOSE<br />
IN THE PREVIUS QUESTION AFTER THE OPENING OF<br />
FREQUENCY OF TRIPS TO THE MAIN PURPOSE<br />
HANS BROGES GADE?<br />
1% 1% 2%<br />
25%<br />
20%<br />
15%<br />
30%<br />
25%<br />
20%<br />
15%<br />
25%<br />
20%<br />
15%<br />
16%<br />
7%<br />
NO ANSWER<br />
MORE RARELY<br />
NOT AS OFTEN<br />
10%<br />
10%<br />
10%<br />
JUST AS OFTEN AS BEFORE<br />
5%<br />
5%<br />
5%<br />
MORE OFTEN<br />
0%<br />
NO 00 - 10<br />
ANSWER YEARS<br />
11 - 20<br />
YEARS<br />
21 - 30<br />
YEARS<br />
31 - 40<br />
YEARS<br />
41 - 50<br />
YEARS<br />
51 - 60<br />
YEARS<br />
Figure 3.2.48: Distribution of the respondents by age groups.<br />
61 - 70<br />
YEARS<br />
71 - 80<br />
YEARS<br />
81 - 90<br />
YEARS<br />
The majority of the respondents at Hans Broges Gade<br />
are between 21-30 years (30%), followed by respondents<br />
aged 31-40 (19%) and aged 41-50 (15%). Older respondents<br />
range from aged from 51-60 (12%), age 61-70 (9%)<br />
and age 71-80 (2%). Younger respondents were in the<br />
aged 11-20 (6%) and age 0-10 (1%). No answer 3%. This<br />
shows that Hans Broges Gade is used mostly by younger<br />
people but also that the site is use by a wide ranges of<br />
ages.<br />
0%<br />
NO ANSWER<br />
PUBLIC<br />
SCHOOL<br />
VOCATIONAL<br />
EDUCATION<br />
HIGH<br />
SCHOOL<br />
SHORT<br />
HIGHER<br />
EDUCATION<br />
Figure 3.2.50: Distribution of the respondents by educational level.<br />
MEDIUM<br />
HIGHER<br />
EDUCATION<br />
LONG<br />
HIGHER<br />
EDUCATION<br />
The large majority of respondents answered that they<br />
have a long higher education (34%), or a medium long,<br />
higher education (32%). 7% respondents answered that<br />
they had attended higher education for a short amount of<br />
time, and another 7% respondents answered a vocational<br />
education. 12% of the respondents had a gymnasium<br />
education, 6% had receiving a public school education,<br />
and 2% giving no answer. It can thereby be concluded<br />
that the users of Hans Broges Gade overall have a high<br />
education level.<br />
0%<br />
NO ANSWER 6-7 DAYS OF<br />
WEEK<br />
5 DAYS OF<br />
WEEK<br />
3-4 DAYS OF<br />
WEEK<br />
1-2 DAYS OF 1-3 DAYS OF<br />
WEEK MONTHS<br />
Figure 3.2.52: Distribution of the respondents by the frequency they walk at Hans<br />
Broges Gade.<br />
MORE<br />
RARELY<br />
Respondents were asked if they walk at Hans Broges<br />
Gade without bike. A majority responded traveled rarely<br />
without bike (26%). However, 21% answered to walk in<br />
the site 6-7 days a week (21%). 13% said 1-3 days a<br />
month, 17% said 1-2 days a week, 13% said 3-4 days a<br />
week, 7% stated 5 days a week and 2% gave no answer.<br />
This data shows that individuals that ride their bikes at<br />
Hans Broes Gade also walk in the site without their bikes.<br />
73%<br />
MUCH MORE OFTEN<br />
Figure 3.2.54: Distribution of the respondents by the frequency they ride a bike in<br />
Hans Broges Gade for the main purpose mentioned in the Figure 3.2.53 after the<br />
intervention in the site.<br />
Respondents were asked, how often they use the bike<br />
for their main purposed as answered in previous question<br />
after the opening of Hans Broges Gade. 73% of respondents<br />
answered that they travel for that purpose just<br />
as often as before. 16% of respondents stated that they<br />
bike for that purpose more often and 7% said much more<br />
often. Only 2 % in total answered that they traveled less<br />
often and 1 % much less often. 1 % gave no answer. This<br />
data indicates that the opening of Hans Broges Gade<br />
have had an small impact on the amount of travelers, The<br />
opening have therefore had a impact on the bikeability of<br />
the city.<br />
GENDER<br />
GENDER<br />
RIDING A BIKE AT HANS BROGES GADE<br />
HOW OFTEN DO YOU BIKE ON HANS BROGES GADE?<br />
MAIN TRIP PURPOSE<br />
WHAT IS YOUR PURPOSE ON HANS BROGES GADE?<br />
SATISFACTION HOW SATISFIED WITH ARE YOU HANS WITH BROGES HANS BROGES GADE GADE?<br />
52%<br />
4%<br />
44%<br />
NO ANSWER<br />
MAN<br />
WOMEN<br />
35%<br />
30%<br />
25%<br />
20%<br />
15%<br />
10%<br />
13%<br />
19%<br />
11%<br />
2%<br />
45%<br />
NO ANSWER<br />
TRANSPORTATION TO AND<br />
FROM WORK<br />
RECREATION / LEISURE<br />
VISIT FAMILY / FRIENDS<br />
PURCHASING / SHOPPING<br />
33%<br />
3%<br />
14%<br />
11%<br />
1%<br />
NO ANSWER<br />
VERY DISSATISFIED<br />
DISSATISFIED<br />
NEUTRAL<br />
SATISFIED<br />
Figure 3.2.49: Distribution of the respondents by gender.<br />
5%<br />
0%<br />
NO ANSWER 6-7 DAYS OF<br />
WEEK<br />
5 DAYS OF<br />
WEEK<br />
3-4 DAYS OF<br />
WEEK<br />
1-2 DAYS OF 1-3 DAYS OF<br />
WEEK MONTHS<br />
MORE<br />
RARELY<br />
Figure 3.2.51: Distribution of the respondents by the frequency they ride a bicycle at<br />
Hans Broges Gade.<br />
4%<br />
6%<br />
TRANSPORTATION TO AND<br />
FROM SCHOOL<br />
OTHERS<br />
Figure 3.2.53: Distribution of the respondents by main trip purpose when riding a bike<br />
in Hans Broges Gade.<br />
38%<br />
VERY SATISFIED<br />
Figure 3.2.55: Distribution of the respondents by the level of satisfaction with the<br />
design of Hans Broges Gade<br />
When asked about their gender, 52% of the respondents<br />
were women and 44% were men, with 4% giving no answer.<br />
When asked how often they bike at the site, the majority<br />
50% of the respondents said that they use the bridge 5<br />
days per week (22%) or 6-7 days per week (31%). 20%<br />
of the respondents used the site 3-4 days per week, 12%<br />
said 1-2 days per week, 10% said 1-3 days per month and<br />
only 4% said that they rarely ride a bike that. The figures<br />
highlight that the site is a place where young people bike<br />
many days of the week.<br />
When asked for what purpose the respondents use Hans<br />
Broges Gade, 45% answered that they use the infrastructure<br />
for commuting to and from work. A great percentage<br />
19% also used Hans Broges Gade for shopping, 13%<br />
used it to commute to school, 4% answered to see friends<br />
or family, 6% for recreation, 11% said other purpose and<br />
2% gave no answer. This figure shows that Hans Broges<br />
Gade is as infrastructural element used for commuting<br />
but the street also has other infrastructural purposes.<br />
When asked how satisfied the respondent were with Hans<br />
Broges Gade 71% in total of them where satisfied (38%)<br />
or very satisfied (33%) with the new infrastructure. 11%<br />
were neutral, 1% were dissatisfied and 15% were very<br />
dissatisfied. 3% gave no answer. This figure shows that<br />
the majority likes the urban space wail a small majority of<br />
15% that have issues with Hans Broges Gade.<br />
90 91


