

Aalborg Universitet Bike Infrastructures Report Silva, Victor ... - VBN
Aalborg Universitet Bike Infrastructures Report Silva, Victor ... - VBN
Aalborg Universitet Bike Infrastructures Report Silva, Victor ... - VBN

You also want an ePaper? Increase the reach of your titles
YUMPU automatically turns print PDFs into web optimized ePapers that Google loves.
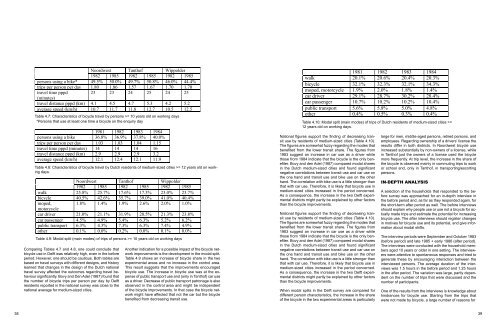
Noordwest Tanthof Wippolder<br />
1982 1985 1982 1985 1982 1985<br />
persons using a bike* 49.5% 50.0% 49.7% 50.8% 46.0% 44.4%<br />
trips per person per day 1.80 1.86 1.57 1.67 1.70 1.70<br />
travel time pppd 23 23 24 25 24 25<br />
(minutes)<br />
travel distance pppd (km) 4.1 4.5 4.7 5.3 4.2 5.2<br />
average speed (km/h) 10.7 11.7 11.8 12.7 10.5 12.5<br />
Table 4.7: Characteristics of bicycle travel by persons >= 10 years old on working days<br />
*Persons that use at least one time a bicycle on the enquiry day<br />
1981 1982 1983 1984<br />
persons using a bike 36.8% 36.9% 37.8% 40.0%<br />
trips per person per day 1.03 1.03 1.04 1.15<br />
travel time pppd (minutes) 14 14 14 16<br />
travel distance pppd (km) 2.9 2.9 2.9 3.2<br />
average speed (km/h) 12.1 12.4 12.1 11.9<br />
Table 4.8: Characteristics of bicycle travel by Dutch residents of medium-sized cities >= 12 years old on working<br />
days.<br />
Noordwest Tanthof Wippolder<br />
1982 1985 1982 1985 1982 1985<br />
walk 25.8% 25.7% 17.6% 17.3% 23.0% 23.7%<br />
bicycle 40.5% 42.6% 35.7% 39.0% 41.0% 40.4%<br />
moped,<br />
1.8% 1.4% 1.9% 2.6% 2.0% 1.0%<br />
motorcycle<br />
car driver 21.0% 21.1% 31.9% 28.5% 21.3% 23.8%<br />
car passenger 4.5% 4.9% 5.4% 6.3% 5.2% 6.2%<br />
public transport 6.3% 4.3% 7.3% 6.3% 7.4% 4.9%<br />
other 0.1% 0.0% 0.2% 0.0% 0.1% 0.0%<br />
Table 4.9: Modal split (main modes) of trips of persons >= 10 years old on working days<br />
Comparing Tables 4.7 and 4.8, one could conclude that<br />
bicycle use in Delft was relatively high, even in the before<br />
period. However, one should be cautious. Both tables are<br />
based on travel surveys with different designs, and history<br />
learned that changes in the design of the Dutch national<br />
travel survey affected the outcomes regarding travel behaviour<br />
significantly. Bovy and Den Adel (1987) found that<br />
the number of bicycle trips per person per day by Delft<br />
residents reported in the national survey was close to the<br />
national average for medium-sized cities.<br />
Another indication for a possible impact of the bicycle network<br />
improvements is the development in the modal split.<br />
Table 4.9 shows an increase of bicycle share in the two<br />
experimental areas and no increase in the control area.<br />
This result suggests that the improvements encouraged<br />
bicycle use. The increase in bicycle use was at the expense<br />
of public transport use and (only in Tanthof) car use<br />
as a driver. Decrease of public transport patronage is also<br />
observed in the control area and might be independent<br />
of the bicycle improvements. In that case the bicycle network<br />
might have affected that not the car but the bicycle<br />
benefited from decreasing transit use.<br />
1981 1982 1983 1984<br />
walk 20.1% 20.6% 20.4% 20.3%<br />
bicycle 32.1% 32.3% 32.1% 34.3%<br />
moped, motorcycle 1.9% 2.0% 1.8% 1.4%<br />
car driver 29.1% 28.7% 30.2% 28.4%<br />
car passenger 10.7% 10.2% 10.2% 10.4%<br />
public transport 5.6% 5.8% 5.0% 4.8%<br />
other 0.4% 0.5% 0.3% 0.4%<br />
Table 4.10: Modal split (main modes) of trips of Dutch residents of medium-sized cities >=<br />
12 years old on working days.<br />
National figures support the finding of decreasing transit<br />
use by residents of medium-sized cities (Table 4.10).<br />
The figures are somewhat fuzzy regarding the modes that<br />
benefited from the lower transit share. The figures from<br />
1983 suggest an increase in car use as a driver while<br />
those from 1984 indicate that the bicycle is the only benefiter.<br />
Bovy and den Adel (1987) compared modal shares<br />
in the Dutch medium-sized cities and found significant<br />
negative correlations between transit use and car use on<br />
the one hand and transit use and bike use on the other<br />
hand. The correlation with bike use is a little stronger than<br />
that with car use. Therefore, it is likely that bicycle use in<br />
medium-sized cities increased in the period concerned.<br />
As a consequence, the increase in the two Delft experimental<br />
districts might partly be explained by other factors<br />
than the bicycle improvements.<br />
When modal splits in the Delft survey are compared for<br />
different person characteristics, the increase in the share<br />
of the bicycle in the two experimental areas is particularly<br />
large for men, middle-aged persons, retired persons, and<br />
employees. Regarding ownership of a drivers’ license the<br />
results differ in both districts. In Noordwest bicycle use<br />
increased substantially by non-owners of a license, while<br />
in Tanthof just the owners of a license used the bicycle<br />
more frequently. At trip level, the increase in the share of<br />
the bicycle is observed mainly in commuting trips to work<br />
or school and, only in Tanthof, in transporting/escorting<br />
persons.<br />
In-depth analysis<br />
A selection of the households that responded to the before<br />
survey was approached for an in-depth interview in<br />
the before period and, as far as they responded again, for<br />
the short-term after period as well. The before interviews<br />
should explain why people use or use not a bicycle for actually<br />
made trips and estimate the potential for increasing<br />
bicycle use. The after interviews should register changes<br />
in motives for bicycle use and its potential, and give information<br />
about modal shifts.<br />
The interview periods were September and October 1983<br />
(before period) and late 1985 + early 1986 (after period).<br />
The interviews were conducted with the household members<br />
aged 10 years or older in one setting. The interviewers<br />
were attentive to spontaneous responses and tried to<br />
generate these by encouraging interaction between the<br />
interviewed persons. The average duration of the interviews<br />
was 1.5 hours in the before period and 1.25 hours<br />
in the after period. The variation was large, partly dependent<br />
on the number of trips that were discussed and the<br />
number of participants.<br />
One of the results from the interviews is knowledge about<br />
hindrances for bicycle use. Starting from the trips that<br />
were not made by bicycle, a large number of reasons for<br />
38 39


