

Aalborg Universitet Bike Infrastructures Report Silva, Victor ... - VBN
Aalborg Universitet Bike Infrastructures Report Silva, Victor ... - VBN
Aalborg Universitet Bike Infrastructures Report Silva, Victor ... - VBN

You also want an ePaper? Increase the reach of your titles
YUMPU automatically turns print PDFs into web optimized ePapers that Google loves.
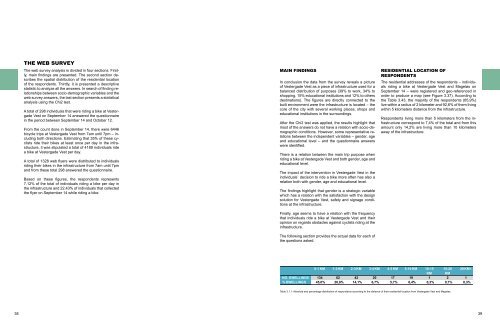
THE WEB SURVEY<br />
The web survey analysis is divided in four sections. Firstly,<br />
main findings are presented. The second section describes<br />
the spatial distribution of the residential location<br />
of the respondents. Thirdly, it is presented a descriptive<br />
statistic to analyze all the answers. In search of finding relationships<br />
between socio-demographic variables and the<br />
web survey answers, the last section presents a statistical<br />
analysis using the Chi2 test.<br />
A total of 298 individuals that were riding a bike at Vestergade<br />
Vest on September 14 answered the questionnaire<br />
in the period between September 14 and October 12.<br />
From the count done in September 14, there were 6446<br />
bicycle trips at Vestergade Vest from 7am until 7pm – including<br />
both directions. Estimating that 35% of these cyclists<br />
ride their bikes at least once per day in the infrastructure,<br />
it was stipulated a total of 4189 individuals ride<br />
a bike at Vestergade Vest per day.<br />
A total of 1328 web flyers were distributed to individuals<br />
riding their bikes in the infrastructure from 7am until 7pm<br />
and from these total 298 answered the questionnaire.<br />
Based on these figures, the respondents represents<br />
7,12% of the total of individuals riding a bike per day in<br />
the infrastructure and 22,43% of individuals that collected<br />
the flyer on September 14 while riding a bike.<br />
MAIN FINDINGS<br />
In conclusion the data from the survey reveals a picture<br />
of Vestergade Vest as a piece of infrastructure used for a<br />
balanced distribution of purposes (39% to work, 34% to<br />
shopping, 15% educational institutions and 12% to others<br />
destinations). The figures are directly connected to the<br />
built environment were the infrastructure is located – the<br />
core of the city with several working places, shops and<br />
educational institutions in the surroundings.<br />
After the Chi2 test was applied, the results highlight that<br />
most of the answers do not have a relation with socio-demographic<br />
conditions. However, some representative relations<br />
between the independent variables – gender, age<br />
and educational level – and the questionnaire answers<br />
were identified.<br />
There is a relation between the main trip purpose when<br />
riding a bike at Vestergade Vest and both gender, age and<br />
educational level.<br />
The impact of the intervention in Vestergade Vest in the<br />
individuals` decision to ride a bike more often has also a<br />
relation both with gender, age and educational level.<br />
The findings highlight that gender is a strategic variable<br />
which has a relation with the satisfaction with the design<br />
solution for Vestergade Vest, safety and signage conditions<br />
at the infrastructure.<br />
Finally, age seems to have a relation with the frequency<br />
that individuals ride a bike at Vestergade Vest and their<br />
opinion on regards obstacles against cyclists riding at the<br />
infrastructure.<br />
The following section provides the actual data for each of<br />
the questions asked.<br />
RESIDENTIAL LOCATION OF<br />
RESPONDENTS<br />
The residential addresses of the respondents – individuals<br />
riding a bike at Vestergade Vest and Mageløs on<br />
September 14 – were registered and geo-referenced in<br />
order to produce a map (see Figure 3.37). According to<br />
the Table 3.43, the majority of the respondents (65,9%)<br />
live within a radius of 2 kilometer and 92,6% of them living<br />
within 5 kilometers distance from the infrastructure.<br />
Respondents living more than 5 kilometers from the infrastructure<br />
correspond to 7,4% of the total and from this<br />
amount only 14,2% are living more than 10 kilometers<br />
away of the infrastructure.<br />
0-1 KM 1-2 KM 2-3 KM 3-4 KM 4-5 KM 5-10 KM 10-15 15-20 20 KM<<br />
KM KM<br />
NO. DWELLINGS 134 62 42 20 17 19 1 2 1<br />
% DWELLINGS 45,0% 20,8% 14,1% 6,7% 5,7% 6,4% 0,3% 0,7% 0,3%<br />
Table 3.1.1: Absolute and percentage distribution of respondents according to the distance of their residential location from Vestergade Vest and Mageløs.<br />
38 39


