

Aalborg Universitet Bike Infrastructures Report Silva, Victor ... - VBN
Aalborg Universitet Bike Infrastructures Report Silva, Victor ... - VBN
Aalborg Universitet Bike Infrastructures Report Silva, Victor ... - VBN

You also want an ePaper? Increase the reach of your titles
YUMPU automatically turns print PDFs into web optimized ePapers that Google loves.
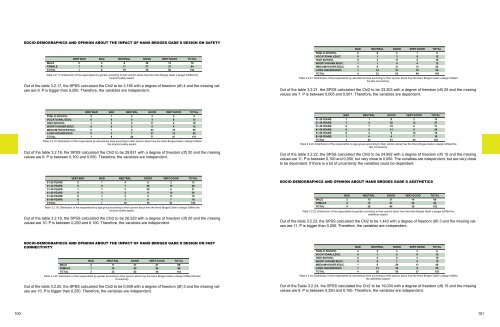
SOCIO-DEMOGRAPHICS AND OPINION ABOUT THE IMPACT OF HANS BROGES GADE`S DESIGN ON SAFETY<br />
VERY BAD BAD NEUTRAL GOOD VERY GOOD TOTAL<br />
MALE 0 4 8 39 19 70<br />
FEMALE 1 4 11 37 31 84<br />
TOTAL 1 8 19 76 50 154<br />
Table 3.2.17: Distribution of the respondents by gender according to their opinion about how the Hans Broges Gade`s design fulfilled the<br />
bicyclist safety aspect.<br />
Out of the table 3.2.17, the SPSS calculated the Chi2 to be 3,160 with a degree of freedom (df) 4 and the missing values<br />
are 9. P is bigger than 0,250. Therefore, the variables are independent.<br />
BAD NEUTRAL GOOD VERY GOOD TOTAL<br />
PUBLIC SCHOOL 2 0 5 1 8<br />
VOCATIONAL EDUC. 0 1 3 8 12<br />
HIGH SCHOOL 0 3 11 5 19<br />
SHORT HIGHER EDUC. 1 1 6 4 12<br />
MEDIUM HIGHER EDUC. 0 6 31 13 50<br />
LONG HIGHER EDUC. 1 12 27 15 55<br />
TOTAL 4 23 83 46 156<br />
Table 3.2.21: Distribution of the respondents by educational level according to their opinion about how the Hans Broges Gade`s design fulfilled<br />
the fast connectivity.<br />
Out of the table 3.2.21, the SPSS calculated the Chi2 to be 33,203 with a degree of freedom (df) 25 and the missing<br />
values are 7. P is between 0,005 and 0,001. Therefore, the variables are dependent.<br />
VERY BAD BAD NEUTRAL GOOD VERY GOOD TOTAL<br />
PUBLIC SCHOOL 0 1 2 2 4 9<br />
VOCATIONAL EDUC. 0 0 0 4 8 12<br />
HIGH SCHOOL 1 3 2 11 2 19<br />
SHORT HIGHER EDUC. 0 0 3 5 4 12<br />
MEDIUM HIGHER EDUC. 0 1 6 24 19 50<br />
LONG HIGHER EDUC. 0 3 7 31 14 55<br />
TOTAL 1 8 20 77 51 157<br />
Table 3.2.18: Distribution of the respondents by educational level according to their opinion about how the Hans Broges Gade`s design fulfilled<br />
the bicyclist safety aspect.<br />
Out of the table 3.2.18, the SPSS calculated the Chi2 to be 29,831 with a degree of freedom (df) 20 and the missing<br />
values are 6. P is between 0,100 and 0,050. Therefore, the variables are independent.<br />
BAD NEUTRAL GOOD VERY GOOD TOTAL<br />
01-20 YEARS 1 1 9 2 13<br />
21-30 YEARS 1 4 30 12 47<br />
31-40 YEARS 0 7 18 6 31<br />
41-50 YEARS 0 5 13 6 24<br />
51-60 YEARS 0 2 5 12 19<br />
61-90 YEARS 1 4 6 7 18<br />
TOTAL 3 23 81 45 152<br />
Table 3.2.22: Distribution of the respondents by age groups according to their opinion about how the Hans Broges Gade`s design fulfilled the<br />
fast connectivity.<br />
Out of the table 3.2.22, the SPSS calculated the Chi2 to be 24,992 with a degree of freedom (df) 15 and the missing<br />
values are 11. P is between 0,100 and 0,050, but very close to 0,050. The variables are independent, but are very close<br />
to be dependent. If there is a bit of uncertainty the variables could be dependent.<br />
VERY BAD BAD NEUTRAL GOOD VERY GOOD TOTAL<br />
01-20 YEARS 0 1 4 6 2 13<br />
21-30 YEARS 0 0 7 26 15 48<br />
31-40 YEARS 1 1 3 20 6 31<br />
41-50 YEARS 0 3 2 9 10 24<br />
51-60 YEARS 0 1 2 5 11 19<br />
61-90 YEARS 0 1 1 9 7 18<br />
TOTAL 1 7 19 75 51 153<br />
Table 3.2.19: Distribution of the respondents by age group according to their opinion about how the Hans Broges Gade`s design fulfilled the<br />
bicyclist safety aspect.<br />
Out of the table 3.2.19, the SPSS calculated the Chi2 to be 26,529 with a degree of freedom (df) 20 and the missing<br />
values are 10. P is between 0,250 and 0,100. Therefore, the variables are independent.<br />
SOCIO-DEMOGRAPHICS AND OPINION ABOUT HANS BROGES GADE`S AESTHETICS<br />
BAD NEUTRAL GOOD VERY GOOD TOTAL<br />
MALE 2 15 37 14 68<br />
FEMALE 2 13 47 22 84<br />
TOTAL 4 28 84 36 152<br />
Table 3.2.23: Distribution of the respondents by gender according to their opinion about how the Hans Broges Gade`s design fulfilled the<br />
aesthetics aspect.<br />
Out of the table 3.2.23, the SPSS calculated the Chi2 to be 1,443 with a degree of freedom (df) 3 and the missing values<br />
are 11. P is bigger than 0,250. Therefore, the variables are independent.<br />
SOCIO-DEMOGRAPHICS AND OPINION ABOUT THE IMPACT OF HANS BROGES GADE`S DESIGN ON FAST<br />
CONNECTIVITY<br />
BAD NEUTRAL GOOD VERY GOOD TOTAL<br />
MALE 2 9 37 21 69<br />
FEMALE 1 14 45 24 84<br />
TOTAL 3 23 82 45 153<br />
Table 3.2.20: Distribution of the respondents by gender according to their opinion about how the Hans Broges Gade`s design fulfilled the fast<br />
connectivity.<br />
Out of the table 3.2.20, the SPSS calculated the Chi2 to be 0,939 with a degree of freedom (df) 3 and the missing values<br />
are 10. P is bigger than 0,250. Therefore, the variables are independent.<br />
BAD NEUTRAL GOOD VERY GOOD TOTAL<br />
PUBLIC SCHOOL 0 2 3 3 8<br />
VOCATIONAL EDUC. 0 1 5 6 12<br />
HIGH SCHOOL 2 5 9 3 19<br />
SHORT HIGHER EDUC. 0 0 7 5 12<br />
MEDIUM HIGHER EDUC. 1 8 29 11 49<br />
LONG HIGHER EDUC. 1 13 32 9 55<br />
TOTAL 4 29 85 37 155<br />
Table 3.2.24: Distribution of the respondents by educational level according to their opinion about how the Hans Broges Gade`s design fulfilled<br />
the aesthetics aspect.<br />
Out of the Table 3.2.24, the SPSS calculated the Chi2 to be 19,034 with a degree of freedom (df) 15 and the missing<br />
values are 8. P is between 0,250 and 0,100. Therefore, the variables are independent.<br />
100 101


