

Aalborg Universitet Bike Infrastructures Report Silva, Victor ... - VBN
Aalborg Universitet Bike Infrastructures Report Silva, Victor ... - VBN
Aalborg Universitet Bike Infrastructures Report Silva, Victor ... - VBN

You also want an ePaper? Increase the reach of your titles
YUMPU automatically turns print PDFs into web optimized ePapers that Google loves.
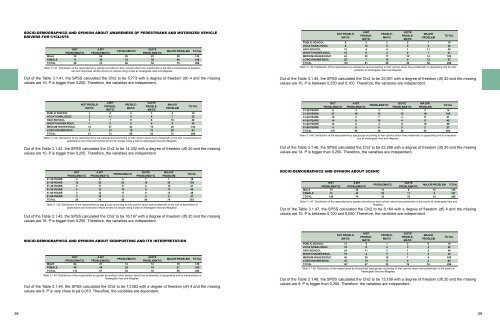
SOCIO-DEMOGRAPHICS AND OPINION ABOUT AWARENESS OF PEDESTRIANS AND MOTORIZED VEHICLE<br />
DRIVERS FOR CYCLISTS<br />
NOT<br />
A BIT<br />
QUITE<br />
PROBLEMATIC<br />
PROBLEMATIC PROBLEMATIC<br />
PROBLEMATIC<br />
MAJOR PROBLEM TOTAL<br />
MALE 18 36 25 22 29 130<br />
FEMALE 11 36 35 30 46 158<br />
TOTAL 38 72 60 52 75 288<br />
Table 3.1.41: Distribution of the respondents by gender according to their opinion about how problematic is the lack of awareness of pedestrians<br />
and motorized vehicle drivers for people riding a bike at Vestergade Vest and Mageløs.<br />
Out of the Table 3.1.41, the SPSS calculated the Chi2 to be 5,773 with a degree of freedom (df) 4 and the missing<br />
values are 10. P is bigger than 0,250. Therefore, the variables are independent.<br />
NOT PROBLE-<br />
MATIC<br />
A BIT<br />
PROBLE-<br />
MATIC<br />
PROBLE-<br />
MATIC<br />
QUITE<br />
PROBLE-<br />
MATIC<br />
MAJOR<br />
PROBLEM<br />
PUBLIC SCHOOL 9 5 2 2 1 19<br />
VOCATIONAL EDUC. 6 12 4 5 5 32<br />
HIGH SCHOOL 15 9 4 1 11 40<br />
SHORT HIGHER EDUC. 10 6 2 6 7 31<br />
MEDIUM HIGHER EDUC. 42 22 17 10 14 105<br />
LONG HIGHER EDUC. 28 7 10 6 12 63<br />
TOTAL 110 61 39 30 50 290<br />
Table 3.1.45: Distribution of the respondents by educational level according to their opinion about how problematic is signposting and its interpretation<br />
at Vestergade Vest and Mageløs.<br />
Out of the Table 3.1.45, the SPSS calculated the Chi2 to be 25,951 with a degree of freedom (df) 20 and the missing<br />
values are 10. P is between 0,250 and 0,100. Therefore, the variables are independent.<br />
TOTAL<br />
NOT PROBLE-<br />
MATIC<br />
A BIT<br />
PROBLE-<br />
MATIC<br />
PROBLE-<br />
MATIC<br />
QUITE<br />
PROBLE-<br />
MATIC<br />
MAJOR<br />
PROBLEM<br />
PUBLIC SCHOOL 1 8 3 3 4 19<br />
VOCATIONAL EDUC. 3 11 5 6 7 32<br />
HIGH SCHOOL 3 7 11 9 10 40<br />
SHORT HIGHER EDUC. 1 6 8 6 9 30<br />
MEDIUM HIGHER EDUC. 14 27 23 15 25 104<br />
LONG HIGHER EDUC. 7 13 10 13 20 63<br />
TOTAL 27 72 60 52 75 288<br />
Table 3.1.42: Distribution of the respondents by educational level according to their opinion about how problematic is the lack of awareness of<br />
pedestrians and motorized vehicle drivers for people riding a bike at Vestergade Vest and Mageløs.<br />
Out of the Table 3.1.42, the SPSS calculated the Chi2 to be 14,302 with a degree of freedom (df) 20 and the missing<br />
values are 10. P is bigger than 0,250. Therefore, the variables are independent.<br />
TOTAL<br />
NOT<br />
A BIT<br />
QUITE<br />
MAJOR<br />
PROBLEMATIC<br />
PROBLEMATIC PROBLEMATIC<br />
PROBLEMATIC PROBLEM<br />
TOTAL<br />
01-20 YEARS 8 3 2 1 2 16<br />
21-30 YEARS 47 18 12 12 16 105<br />
31-40 YEARS 15 5 7 3 11 41<br />
41-50 YEARS 14 8 10 4 9 45<br />
51-60 YEARS 14 5 3 8 10 50<br />
61-90 YEARS 9 9 5 2 2 27<br />
TOTAL 107 58 39 30 50 284<br />
Table 3.1.46: Distribution of the respondents by age groups according to their opinion about how problematic is signposting and its interpretation<br />
at Vestergade Vest and Mageløs.<br />
Out of the Table 3.1.46, the SPSS calculated the Chi2 to be 23,288 with a degree of freedom (df) 20 and the missing<br />
values are 14. P is bigger than 0,250. Therefore, the variables are independent.<br />
NOT<br />
A BIT<br />
QUITE<br />
MAJOR<br />
PROBLEMATIC<br />
PROBLEMATIC PROBLEMATIC<br />
PROBLEMATIC PROBLEM<br />
TOTAL<br />
01-20 YEARS 2 2 4 7 1 16<br />
21-30 YEARS 12 23 22 18 30 105<br />
31-40 YEARS 5 11 8 4 13 41<br />
41-50 YEARS 4 12 10 8 11 45<br />
51-60 YEARS 3 12 11 9 13 48<br />
61-90 YEARS 3 10 4 4 6 27<br />
TOTAL 29 70 59 50 74 282<br />
Table 3.1.43: Distribution of the respondents by age groups according to their opinion about how problematic is the lack of awareness of<br />
pedestrians and motorized vehicle drivers for people riding a bike at Vestergade Vest and Mageløs.<br />
Out of the Table 3.1.43, the SPSS calculated the Chi2 to be 16,197 with a degree of freedom (df) 20 and the missing<br />
values are 16. P is bigger than 0,250. Therefore, the variables are independent.<br />
SOCIO-DEMOGRAPHICS AND OPINION ABOUT SCENIC<br />
NOT<br />
A BIT<br />
QUITE<br />
PROBLEMATIC<br />
PROBLEMATIC PROBLEMATIC<br />
PROBLEMATIC<br />
MAJOR PROBLEM TOTAL<br />
MALE 72 26 13 8 10 129<br />
FEMALE 74 44 22 11 6 157<br />
TOTAL 146 70 35 19 16 286<br />
Table 3.1.47: Distribution of the respondents by gender according to their opinion about how problematic is the scenic at Vestergade Vest and<br />
Mageløs.<br />
Out of the Table 3.1.47, the SPSS calculated the Chi2 to be 8,164 with a degree of freedom (df) 4 and the missing<br />
values are 10. P is between 0,100 and 0,050. Therefore, the variables are independent.<br />
SOCIO-DEMOGRAPHICS AND OPINION ABOUT SIGNPOSTING AND ITS INTERPRETATION<br />
NOT<br />
A BIT<br />
QUITE<br />
PROBLEMATIC<br />
PROBLEMATIC PROBLEMATIC<br />
PROBLEMATIC<br />
MAJOR PROBLEM TOTAL<br />
MALE 64 21 14 12 19 130<br />
FEMALE 46 40 25 18 31 160<br />
TOTAL 110 61 38 30 50 290<br />
Table 3.1.44: Distribution of the respondents by gender according to their opinion about how problematic is signposting and its interpretation at<br />
Vestergade Vest and Mageløs.<br />
Out of the Table 3.1.44, the SPSS calculated the Chi2 to be 13,083 with a degree of freedom (df) 4 and the missing<br />
values are 8. P is very close to på 0,010. Therefore, the variables are dependent.<br />
NOT PROBLE-<br />
MATIC<br />
A BIT<br />
PROBLE-<br />
MATIC<br />
PROBLE-<br />
MATIC<br />
QUITE<br />
PROBLE-<br />
MATIC<br />
MAJOR<br />
PROBLEM<br />
PUBLIC SCHOOL 12 4 1 2 0 19<br />
VOCATIONAL EDUC. 16 8 2 3 3 32<br />
HIGH SCHOOL 24 11 2 1 2 40<br />
SHORT HIGHER EDUC. 15 4 7 1 3 30<br />
MEDIUM HIGHER EDUC. 46 30 18 7 4 105<br />
LONG HIGHER EDUC. 34 12 5 5 4 60<br />
TOTAL 147 67 35 19 16 286<br />
Table 3.1.48: Distribution of the respondents by educational level gender according to their opinion about how problematic is the scenic at<br />
Vestergade Vest and Mageløs.<br />
Out of the Table 3.1.48, the SPSS calculated the Chi2 to be 13,169 with a degree of freedom (df) 20 and the missing<br />
values are 9. P is bigger than 0,250. Therefore, the variables are independent.<br />
TOTAL<br />
58 59


