

Aalborg Universitet Bike Infrastructures Report Silva, Victor ... - VBN
Aalborg Universitet Bike Infrastructures Report Silva, Victor ... - VBN
Aalborg Universitet Bike Infrastructures Report Silva, Victor ... - VBN

Create successful ePaper yourself
Turn your PDF publications into a flip-book with our unique Google optimized e-Paper software.
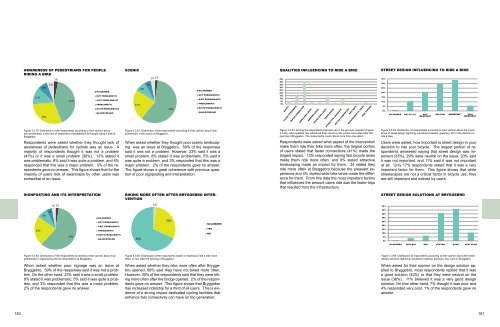
AWARENESS OF PEDESTRIANS FOR PEOPLE<br />
LACK OF AWARENESS FOR THE SURROUNDING PEOPLE<br />
RIDING A BIKE<br />
13%<br />
8%<br />
30%<br />
5%<br />
3%<br />
3% 2%<br />
41%<br />
POOR SIGNPOSTING AND INTERPRETATION<br />
NO ANSWER<br />
NOT PROBLEMATIC<br />
A BIT PROBLEMATIC<br />
PROBLEMATIC<br />
QUITE PROBLEMATIC<br />
MAJOR PROLEM<br />
Figure 3.3.79: Distribution of the respondents according to their opinion about<br />
how problematic is the lack of awareness of pedestrians for people riding a bike at<br />
Bryggebro.<br />
Respondents were asked whether they thought lack of<br />
awareness of pedestrians for cyclists was an issue. A<br />
majority of respondents thought it was not a problem<br />
(41%) or it was a small problem (30%). 13% stated it<br />
was problematic, 8% said it was quite a problem, and 5%<br />
responded that this was a major problem. 3% of the respondents<br />
gave no answer. This figure shows that for the<br />
majority of users lack of awareness by other users was<br />
somewhat of an issue.<br />
SIGNPOSTING AND ITS INTERPRETATION<br />
SCENIC<br />
23%<br />
8%<br />
5%<br />
3% 2%<br />
2%<br />
POOR GREENERY<br />
59%<br />
NO ANSWER<br />
NOT PROBLEMATIC<br />
A BIT PROBLEMATIC<br />
PROBLEMATIC<br />
QUITE PROBLEMATIC<br />
MAJOR PROLEM<br />
Figure 3.3.81: Distribution of the respondents according to their opinion about how<br />
problematic is the scenic at Bryggebro.<br />
When asked whether they thought poor scenic landscaping<br />
was an issue at Bryggebro, 59% of the responses<br />
said it was not a problem. However, 23% said it was a<br />
small problem, 8% stated it was problematic, 5% said it<br />
was quite a problem, and 3% responded that this was a<br />
major problem. 2% of the respondents gave no answer.<br />
The figure shows a great coherence with previous question<br />
of poor signposting and interpretation.<br />
ARE YOU BIKING MORE OFTEN AFTER THE OPENING OF<br />
BIKING MORE OFTEN AFTER BRYGGEBRO INTER-<br />
VENTION<br />
BRYGGEBROEN?<br />
QUALITIES IF YES, INFLUENCING WHAT QUALITIES ABOUT TO RIDE BRYGGEBROEN A BIKEHAS<br />
INFLUENCED YOUR CHOICE OF BIKING MORE OFTEN?<br />
45%<br />
40%<br />
35%<br />
30%<br />
25%<br />
20%<br />
15%<br />
10%<br />
5%<br />
0%<br />
SAFETY<br />
A GOOD EXPERIENCE<br />
FASTER CONNECTION<br />
WIDER BIKE LANES<br />
GREENER AREAS<br />
FASTER BIKE LANES<br />
GREEN WEDGE<br />
ATTRECTIVE LANDSCAPE<br />
BETTER SIGNPOSTING<br />
BIKE MAPS<br />
MAINTENANCE OF BIKES<br />
BIKE PARKING<br />
Figure 3.3.83: Among the respondents that said yes in the previous question (Figure<br />
3.3.82), what qualities has influenced their choice to ride a bike more often after the<br />
opening of Bryggebro. The respondents could choice more than one option.<br />
Respondents were asked what aspect of the intervention<br />
make them ride their bike more often, the largest portion<br />
of users stated that faster connections (41%) made the<br />
largest impact. 13% responded saying fast bicycle lanes<br />
made them ride more often, and 9% stated attractive<br />
landscaping made an impact for them. 34 stated they<br />
ride more often at Bryggebro because the pleasant experience<br />
and 4% replied wide bike lanes made the difference<br />
for them. From this data the most important factors<br />
that influenced the amount users ride was the faster trips<br />
that resulted from the infrastructure.<br />
35%<br />
30%<br />
25%<br />
20%<br />
15%<br />
10%<br />
5%<br />
0%<br />
45%<br />
HOW IMPORTANT IS STREET DESIGN (GREEN AREAS,<br />
LIGHTING, ETC.) FOR YOUR DECISION TO TAKE THE<br />
BIK E?<br />
STREET DESIGN INFLUENCING TO RIDE A BIKE<br />
NO ANSWER NOT AT ALL NOT<br />
IMPORTANT<br />
IMPROTANT<br />
NEUTRAL IMPORTANT<br />
VERY<br />
IMPORTANT<br />
IMPROTANT<br />
Figure 3.3.84: Distribution of respondents according to their opinion about the importance<br />
of street design (lightning, pavement material, greenery, etc) in the decision to<br />
ride a bike.<br />
Users were asked, how important is street design in your<br />
decision to ride your bicycle. The largest portion of respondents<br />
answered saying that street design was important<br />
(33%), 29% were neutral on the issue, 20% said<br />
it was not important, and 11% said it was not important<br />
at all. Only 17% respondents stated that it was a very<br />
important factor for them. This figure shows that while<br />
streetscapes are not a critical factor in bicycle use, they<br />
are still important and noticed by users.<br />
STREET DESIGN SOLUTIONS AT BRYGGEBRO<br />
WHAT DO YOU THINK OF THE DESIGN SOLUTIONS<br />
THAT ARE APPLIED TO BRYGGEBROEN (GREEN AREAS,<br />
L IGHTING, ETC.)?<br />
23%<br />
8%<br />
5%<br />
59%<br />
NO ANSWER<br />
NOT PROBLEMATIC<br />
A BIT PROBLEMATIC<br />
PROBLEMATIC<br />
QUITE PROBLEMATIC<br />
MAJOR PROLEM<br />
68%<br />
30%<br />
NO ANSWER<br />
YES<br />
NO<br />
40%<br />
35%<br />
30%<br />
25%<br />
20%<br />
15%<br />
10%<br />
5%<br />
0%<br />
NO ANSWER VERY BAD BAD NEUTRAL GOOD VERY GOOD<br />
Figure 3.3.80: Distribution of the respondents according to their opinion about how<br />
problematic is signposting and its interpretation at Bryggebro.<br />
When asked whether poor signage was an issue at<br />
Bryggebro, 59% of the responses said it was not a problem.<br />
On the other hand, 23% said it was a small problem,<br />
8% stated it was problematic, 5% said it was quite a problem,<br />
and 3% responded that this was a major problem.<br />
2% of the respondents gave no answer.<br />
Figure 3.3.82: Distribution of the respondents based on starting to ride a bike more<br />
often, or not, after the opening of Bryggebro.<br />
When asked whether they bike more often after Bryggebro<br />
opened, 68% said they have not biked more often.<br />
However, 30% of the respondents said that they were biking<br />
more often after the bridge opened. 2% of the respondents<br />
gave no answer. This figure shows that Bryggebro<br />
has increased ridership for a third of all users. This is evidence<br />
of a strong impact dedicated cycling facilities that<br />
enhance fast connectivity can have on trip generation.<br />
Figure 3.3.85: Distribution of respondents according to their opinion about the street<br />
design solutions (lightning, pavement material, greenery, etc) used in Bryggebro.<br />
When asked for their opinion on the design solution applied<br />
to Bryggebro, most respondents replied that it was<br />
a good solution (42%) or that they were neutral on the<br />
issue (36%). 11% believed it was a very good design<br />
solution. On ther other hand, 7% thought it was poor and<br />
4% responded very poor. 1% of the respondents gave no<br />
answer.<br />
150 151


