

Aalborg Universitet Bike Infrastructures Report Silva, Victor ... - VBN
Aalborg Universitet Bike Infrastructures Report Silva, Victor ... - VBN
Aalborg Universitet Bike Infrastructures Report Silva, Victor ... - VBN

You also want an ePaper? Increase the reach of your titles
YUMPU automatically turns print PDFs into web optimized ePapers that Google loves.
The outcomes of the route analyses presented so far are<br />
just based on the before study. The after study (Gommers<br />
and Bovy, 1987) analysed to which extent the bicycle<br />
interventions influenced route choices. Comparing<br />
the routes of complete trips in the before and after periods<br />
was not possible because only very few trips had<br />
the same origin and destination. Therefore, the analysis<br />
was done for trip sections. A number of pairs of locations<br />
were selected that are passed by a lot of cyclists. The<br />
route choices before and after between these pairs were<br />
studied for all trips that passed both locations. The routes<br />
between 60 pairs of locations were analysed. Significant<br />
changes in the chosen routes were observed. New network<br />
links tempted a lot of cyclists to reroute their trips<br />
via these links. New bicycle paths along roads proved to<br />
be very attractive as well. The volume of cyclists on bicycle<br />
paths increased significantly while the volume on<br />
bicycle lanes (not physically separated from the road)<br />
and on roads with mixed traffic decreased. There was no<br />
change in the division of bicycle kilometres over the three<br />
networks: neighbourhood, district and urban. Absence of<br />
a change is not surprising because the measures were<br />
implemented at all networks. Route choice changes seem<br />
to take some time. A new bridge appeared to attract only<br />
a small part of the cyclists who could shorten their route<br />
by using this bridge. The reason could be that the bridge<br />
was brought into use just one week before the data for the<br />
route choice analysis were collected.<br />
Finally, the route choice studies suggest a large increase<br />
in bicycle use between the before and after periods (see<br />
the cycle counts in Table 4.16). Analysing the origins<br />
and destinations, the increase is mainly due to a huge<br />
increase (28%) in cyclists that traverse the Noordwestdistrict.<br />
Trip numbers of Noordwest-residents seem to<br />
have decreased somewhat, those of Noordwest-visitors<br />
increased a little. The decrease of trips by Noordwestresidents<br />
can be explained by demographic changes and<br />
one major change in land use: a secondary school moved<br />
from outside to inside the Noordwest-district. The large<br />
increase of traversing cyclists might suggest that the bicycle<br />
plan is particularly beneficial for the longer distances.<br />
Though it is likely that this happened, an alternative<br />
explanation is that cyclists shifted their routes from fully<br />
outside the Noordwest-district to partly crossing the district.<br />
The route shift could be induced either by the bicycle<br />
measures and is then still an indication of the attractiveness<br />
of the measures, or by other factors like traffic diversions<br />
due to maintenance works.<br />
4.7.2 Safety<br />
The impacts of the bicycle plan on traffic safety have been<br />
studied for both the short and the long run. Bovy and<br />
Gommers (1988) assume a priori that the measures will<br />
have two kinds of opposite impacts. Firstly, the measures<br />
increased use of the vulnerable bicycle mode that will<br />
have affected traffic safety negatively. Vulnerability of cyclists<br />
is apparent from Dutch statistics concerning casualties<br />
per million person kilometres (CBS, 1994, 1 and CBS,<br />
1994, 2). Both the number of fatalities and the number of<br />
injured persons among cyclists were in the early 1990’s<br />
about three times the average for all modes. Secondly,<br />
the measures made cycling safer and so affected safety<br />
positively. Nearly all accidents result from conflicts between<br />
road users. The measures reduced the number of<br />
conflicts due to building new bicycle paths that separate<br />
cyclists from motorized traffic, and installing traffic lights<br />
at some intersections that should make crossing safer.<br />
The vulnerability of cyclists compared to other road users<br />
is subject for debate. Certainly, the number of accidents<br />
and casualties per km are high for cyclists. However,<br />
related to travel time, the numbers are comparable for<br />
the different modes. Based on the finding in fundamental<br />
research that people tend to spend a constant part of<br />
their time budget on travelling (see for instance Schafer,<br />
1998), accidents and casualties per minute might be a<br />
better measure for vulnerability than numbers per km. In<br />
that case interventions that increase bicycle use will not<br />
directly increase the risk of accidents.<br />
Short-term impacts<br />
Between 1980 and 1986 the total number of accidents in<br />
Delft was stable. These were about 1500 annually, according<br />
to the (incomplete) registration by the police. The<br />
number of casualties decreased in the same period from<br />
about 310 to 260, a reduction of about 20% (Bovy and<br />
Gommers, 1988). The national figures show a similar decrease<br />
of annual casualties in this period despite a substantial<br />
increase in traffic volume: the number of fatalities<br />
decreased by 24%, the number of injured casulaties by<br />
21%. At first sight, the bicycle plan did not contribute to<br />
traffic safety on balance. However, a more detailed analysis<br />
of the figures gives different conclusions.<br />
The short-term decrease of traffic casualties in Delft can<br />
fully be attributed to the bicycle and moped modes. The<br />
number of cycle casualties decreased from about 100 in<br />
1980 to about 70 in 1986, that of the moped casualties<br />
from about 80 to about 60. The number of casualties by<br />
other modes remained stable. The decrease of about<br />
30% for cyclists and moped riders is larger than the national<br />
decrease of 20% for these modes. The national decrease<br />
for the car and most other modes is not observed<br />
in Delft. The relatively large decrease in casualties among<br />
cyclists and moped riders in Delft, both users of the bicycle<br />
infrastructure, is an indication of increased safety<br />
by the bicycle measures. One problem in the analysis is<br />
that the Delft numbers are too low for an accurate estimation<br />
of developments in a few-years period. The numbers<br />
by mode display rather large annual fluctuations. Still, the<br />
decrease in casualties of both cyclists and moped riders<br />
is statistically significant.<br />
The probability for cyclists to be involved in an accident<br />
depends on gender and age. The probability is particularly<br />
high for teenagers. No change of the relative probabilities<br />
is observed between the before and after periods.<br />
The relative decrease of bicycle casualties was similar for<br />
all gender and age classes.<br />
Most bicycle accidents happen by collision of vehicles.<br />
In most cases the collision ‘partner’ of a bicycle is a motor<br />
vehicle. The number of collisions with motor vehicles<br />
decreased somewhat from about 70% of all bicycle accidents<br />
to about 65%. The number of other kinds of bicycle<br />
accidents remained stable. One should note here that bicycle<br />
use increased and use of motorized modes (mainly<br />
car) did not change.<br />
The number of accidents where a bicycle is involved decreased<br />
in Delft by about 10%. This reduction is smaller<br />
than the relative decrease of cycle casualties, which can<br />
be explained by the relatively large decrease of collisions<br />
with motor vehicles. The decrease of bicycle accidents is<br />
fully due to a decrease of accidents at intersections. The<br />
number of bicycle accidents at intersections decreased<br />
by 25%, lowering its share in all bicycle accidents from<br />
55-60% to 45-50%. Still, intersections remain relatively<br />
unsafe for cyclists. For other modes the share of accidents<br />
at intersections is smaller, on average 35%.<br />
Considering type of road, the decrease of bicycle accidents<br />
is observed only on bicycle lanes. There was no<br />
change in accident numbers on bicycle paths and roads<br />
with mixed traffic. However, because of the large changes<br />
in bicycle traffic volumes on the different kind of roads,<br />
one could better compare the risk of involvement in an accident<br />
per million km. This risk decreased significantly on<br />
bicycle paths and bicycle lanes and increased a little on<br />
roads with mixed traffic. Bicycle paths, that were already<br />
the safest kinds of road, strengthened their position as<br />
safest road for cyclists, and bicycle lanes, that were by<br />
far the most unsafe kinds of road came close to the roads<br />
with mixed traffic but remained the most unsafe kind of<br />
road. The relatively high probability to be involved in an<br />
accident when cycling on bicycle lanes can be explained<br />
by the fact that bicycle lanes generally are designed along<br />
busy roads where dedicated bicycle infrastructure is desirable<br />
but room for separated bicycle paths is lacking.<br />
The observations mentioned before suggest that the bicycle<br />
plan had a positive influence on safety. Safety increased<br />
particularly for the cyclists, and the increase in<br />
safety is connected to infrastructural elements (relatively<br />
large on bicycle paths and lanes, and on intersections).<br />
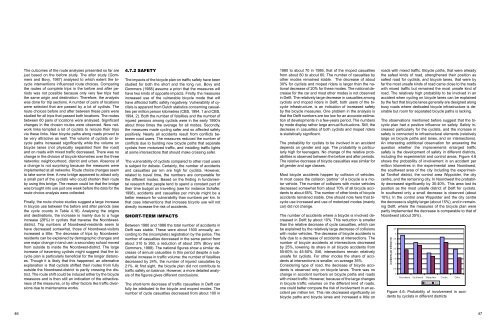
An interesting additional observation for answering the<br />
question whether the improvements enlarged traffic<br />
safety is the development of safety in different districts,<br />
including the experimental and control areas. Figure 4.6<br />
shows the probability of involvement in an accident per<br />
million kilometres in the experimental area Noordwest,<br />
the southwest area of the city including the experimental<br />
Tanthof district, the control area Wippolder, the city<br />
centre, and the remaining city. In Noordwest the probability<br />
decreased significantly by 35-40%. This area lost its<br />
position as the most unsafe district of Delft for cyclists.<br />
In southwest only a small decrease is observed (about<br />
10%). In the control area Wippolder and the city centre<br />
the decrease is slightly larger (about 15%), and in remaining<br />
Delft, where the measures of the bicycle plan were<br />
partly implemented the decrease is comparable to that of<br />
Noordwest (about 35%).<br />
Figure 4.6: Probability of involvement in accidents<br />
by cyclists in different districts<br />
46 47


