

Aalborg Universitet Bike Infrastructures Report Silva, Victor ... - VBN
Aalborg Universitet Bike Infrastructures Report Silva, Victor ... - VBN
Aalborg Universitet Bike Infrastructures Report Silva, Victor ... - VBN

Create successful ePaper yourself
Turn your PDF publications into a flip-book with our unique Google optimized e-Paper software.
not using the bicycle was reported. The reasons were<br />
classified into six categories: no opportunity for using a<br />
bike (for instance no bicycle was available, distance is too<br />
long); practical matters that hamper bicycle use (e.g. luggage<br />
transport) or force to use an alternative mode (e.g.<br />
one should have the car available at the destination);<br />
(perception of) travel time; (perception of) insufficient<br />
infrastructure and traffic situation; (perception of) inconvenience<br />
and insecurity of cycling; and personal preferences<br />
regarding use of the bicycle or other modes. There<br />
is a remaining seventh category consisting of non-bicycle<br />
trips with no hindrance for bicycle use.<br />
Table 4.11 shows the magnitude of the different hindrances<br />
in the before and after periods, starting from the most<br />
objective hindrances and going to the most subjective<br />
ones. The latest category shown is the category without<br />
any hindrance, indicated as ‘freedom of choice’. Two<br />
kinds of hindrances are distinguished: general hindrances<br />
that always are valid for a certain trip (for instance the distance<br />
is too large) and incidental hindrances that are valid<br />
only on the enquiry day (e.g. unlike on other days, the<br />
traveller was accompanied by grandmother who doesn’t<br />
cycle any more).<br />
Practical matters and travel time are the most important<br />
reasons for not using a bicycle. The magnitude of both<br />
hindrances decreased slightly between the before and after<br />
periods. A larger decrease is observed for each of the<br />
other hindrances. Especially infrastructure and traffic exhibit<br />
a relatively large decrease. This is not surprising because<br />
the bicycle plan aims predominantly to improve the<br />
infrastructural and traffic situation. However, in the before<br />
situation, this hindrance was marginal. Looking at Table<br />
4.11, other kinds of measures might be more efficient for<br />
increasing bicycle use.<br />
The large increase of the freedom of choice category for<br />
non-bicycle trips is mainly valid for trips where walking<br />
or car is the actual mode. For walking trips, the general<br />
freedom to choose the bicycle increased from 14% of all<br />
walking trips to 32%, for car trips the increase was from<br />
13% to 34%. A much smaller increase was observed for<br />
trips by public transport: from 29% to 36%.<br />
In addition to the freedom to choose the bike when actually<br />
another mode is used, there can be a freedom to<br />
choose another mode when actually the bicycle is used.<br />
Where the former are relevant for the potential for bicycle<br />
use, the latter indicate the vulnerability of bicycle use.<br />
Table 4.12 shows the hindrances for walking, car use,<br />
or public transport patronage for trips that actually are<br />
made by bicycle. The presented figures are the general<br />
hindrances; figures about the actual hindrances on the<br />
enquiry day (that have a lower freedom of choice) are not<br />
available. Divergent from Table 4.11, the accumulative<br />
impact of the hindrances on the bicycle trips that remain<br />
free of choice is displayed. In 1982, for 3% of the bicycle<br />
trips walking is no option, leaving 97% free of choice.<br />
Next, practical matters generate hindrances for a part of<br />
the remaining bicycle trips, which part equals 11% of all<br />
bicycle trips. Then 86% is still free of choice. After skinning<br />
the trips for all hindrances in this way, 17% remain<br />
where no hindrance is applicable in general (but might still<br />
be applicable on the enquiry day).<br />
hindrance<br />
before<br />
after<br />
general incidental total general incidental total<br />
bicycle no option 12.1% 1.6% 13.7% 6.7% 1.1% 7.7%<br />
practical matters 35.6% 10.6% 46.2% 23.8% 21.2% 44.9%<br />
travel time 45.4% 5.2% 50.6% 34.4% 9.4% 43.8%<br />
infrastructure and 0.8% - 0.8% - 0.3% 0.3%<br />
traffic<br />
inconvenience, 16.8% 4.8% 21.6% 7.9% 5.2% 13.0%<br />
insecurity<br />
personal preferences 17.4% - 17.4% 12.3% - 12.3%<br />
freedom of choice 15.7% - 3.0% 33% - 7%<br />
Table 4.11: Hindrances for bicycle use in percents of non-bicycle trips.<br />
hindrance<br />
walk car public transport<br />
1982 1985 1982 1985 1982 1985<br />
all bicycle trips 100% 100% 100% 100% 100% 100%<br />
mode no option -3% -0% -44% -42% -24% -13%<br />
practical matters -11% -15% -5% -12% -2% -4%<br />
travel time -49% -42% -8% -8% -23% -31%<br />
infrastructure and traffic -0% -0% -2% -1% -3% -2%<br />
inconvenience,<br />
-3% -2% -4% -6% -17% -21%<br />
insecurity<br />
personal preferences -17% -11% -11% -4% -21% -13%<br />
freedom of choice 17% 30% 25% 27% 10% 16%<br />
Table 4.12: Accumulative impact of general hindrances for other modes in percents of bicycle trips<br />
The main hindrance for walking is travel time; the main<br />
hindrance for car use is the unavailability of a car. For<br />
using public transport there are a number of larger hindrances:<br />
mode availability, travel time, inconvenience,<br />
and personal preferences. The freedom to shift from the<br />
bicycle to walking or public transport increased substantially.<br />
The (initially large) freedom to shift to the car is<br />
nearly unaffected.<br />
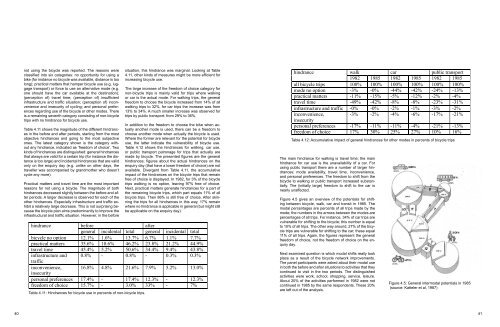
Figure 4.5 gives an overview of the potentials for shifting<br />
between bicycle, walk, car and transit in 1985. The<br />
modal percentages are percents of all trips made by the<br />
mode; the numbers in the arrows between the modes are<br />
percentages of all trips. For instance, 34% of car trips are<br />
vulnerable for shifting to the bicycle; this number is equal<br />
to 10% of all trips. The other way around, 27% of the bicycle<br />
trips are vulnerable for shifting to the car; these equal<br />
11% of all trips. Again, the figures represent the general<br />
freedom of choice, not the freedom of choice on the enquiry<br />
day.<br />
Next examined question is which modal shifts really took<br />
place as a result of the bicycle network improvements.<br />
The panel participants were asked about their modal use<br />
in both the before and after situations to activities that they<br />
continued to visit in the two periods. The distinguished<br />
activities were work, school, shopping, service, leisure.<br />
About 20% of the activities performed in 1982 were not<br />
continued in 1985 by the same respondents. These 20%<br />
are left out of the analysis.<br />
Figure 4.5: General intermodal potentials in 1985<br />
(source: Katteler et al, 1987)<br />
40 41


