

Aalborg Universitet Bike Infrastructures Report Silva, Victor ... - VBN
Aalborg Universitet Bike Infrastructures Report Silva, Victor ... - VBN
Aalborg Universitet Bike Infrastructures Report Silva, Victor ... - VBN

Create successful ePaper yourself
Turn your PDF publications into a flip-book with our unique Google optimized e-Paper software.
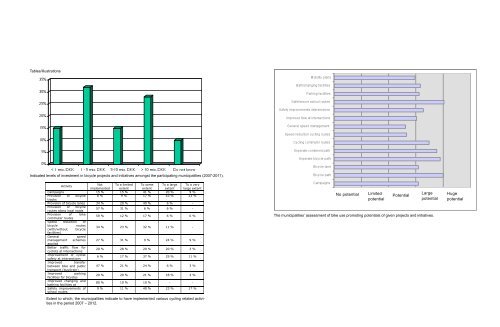
Tables/illustrations<br />
Indicated levels of investment in bicycle projects and initiatives amongst the participating municipalities (2007-2011).<br />
Activity<br />
Not To a limited To some To a large To a very<br />
implemented extent extent extent large extent<br />
Campaigns 15 % 15 % 41 % 20 % 9 %<br />
Provision of bicycle 8 % 9 % 17 % 43 % 23 %<br />
tracks<br />
Provision of bicycle lanes 34 % 20 % 40 % 6 % -<br />
Provision of bicycle<br />
routes along local roads<br />
57 % 31 % 6 % 6 % -<br />
Provision of bike<br />
commuter routes<br />
59 % 12 % 17 % 6 % 6 %<br />
Speed reduction of<br />
bicycle<br />
routes<br />
(with/without bicycle<br />
34 % 23 % 32 % 11 % -<br />
facilities)<br />
General<br />
speed<br />
management schemes 27 % 31 % 9 % 24 % 9 %<br />
applied<br />
Better traffic flow for<br />
cyclists at intersections<br />
20 % 28 % 29 % 20 % 3 %<br />
Improvement of cyclist<br />
safety at intersections<br />
6 % 17 % 37 % 29 % 11 %<br />
Improved transfer<br />
between bike and public 47 % 21 % 24 % 6 % 3 %<br />
transport (bus/train)<br />
Improved parking<br />
facilities for bicycles<br />
29 % 29 % 21 % 18 % 3 %<br />
Improved changing and<br />
bathing facilities at<br />
80 % 10 % 10 % - -<br />
Safety improvements of<br />
school routes<br />
9 % 11 % 40 % 23 % 17 %<br />
Extent to which, the municipalities indicate to have implemented various cycling related activities<br />
in the period 2007 – 2012.<br />
No potential<br />
Limited<br />
potential<br />
Potential<br />
Large<br />
potential<br />
The municipalities’ assessment of bike use promoting potentials of given projects and initiatives.<br />
Huge<br />
potential


