

Aalborg Universitet Bike Infrastructures Report Silva, Victor ... - VBN
Aalborg Universitet Bike Infrastructures Report Silva, Victor ... - VBN
Aalborg Universitet Bike Infrastructures Report Silva, Victor ... - VBN

Create successful ePaper yourself
Turn your PDF publications into a flip-book with our unique Google optimized e-Paper software.
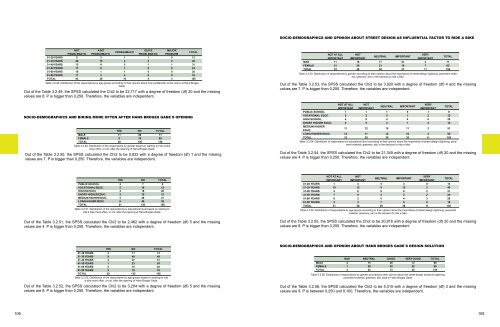
SOCIO-DEMOGRAPHICS AND OPINION ABOUT STREET DESIGN AS INFLUENTIAL FACTOR TO RIDE A BIKE<br />
NOT<br />
A BIT<br />
QUITE<br />
MAJOR<br />
PROBLEMATIC<br />
PROBLEMATIC PROBLEMATIC<br />
PROBLEMATIC PROBLEM<br />
TOTAL<br />
01-20 YEARS 8 3 1 1 0 13<br />
21-30 YEARS 26 15 4 2 2 49<br />
31-40 YEARS 13 11 5 1 1 31<br />
41-50 YEARS 17 6 1 0 0 24<br />
51-60 YEARS 18 1 1 0 0 20<br />
61-90 YEARS 11 3 4 0 0 18<br />
TOTAL 93 39 16 4 3 155<br />
Table 3.2.49: Distribution of the respondents by age groups according to their opinion about how problematic is the scenic at Hans Broges<br />
Gade.<br />
Out of the Table 3.2.49, the SPSS calculated the Chi2 to be 22,717 with a degree of freedom (df) 20 and the missing<br />
values are 8. P is bigger than 0,250. Therefore, the variables are independent.<br />
SOCIO-DEMOGRAPHICS AND BIKING MORE OFTEN AFTER HANS BROGES GADE`S OPENING<br />
YES NO TOTAL<br />
MALE 11 60 71<br />
FEMALE 9 76 85<br />
TOTAL 20 136 156<br />
Table 3.2.50: Distribution of the respondents by gender based on starting to ride a bike<br />
more often, or not, after the opening of Hans Broges Gade.<br />
Out of the Table 3.2.50, the SPSS calculated the Chi2 to be 0,833 with a degree of freedom (df) 1 and the missing<br />
values are 7. P is bigger than 0,250. Therefore, the variables are independent.<br />
NOT AT ALL NOT<br />
VERY<br />
NEUTRAL IMPORTANT<br />
IMPORTANT IMPORTANT<br />
IMPORTANT<br />
TOTAL<br />
MAN 11 18 17 21 4 71<br />
FEMALE 21 20 21 16 7 85<br />
TOTAL 32 38 38 37 11 156<br />
Table 3.2.53: Distribution of respondents by gender according to their opinion about the importance of street design (lightning, pavement material,<br />
greenery, etc) in the decision to ride a bike.<br />
Out of the Table 3.2.53, the SPSS calculated the Chi2 to be 3,920 with a degree of freedom (df) 4 and the missing<br />
values are 7. P is bigger than 0,250. Therefore, the variables are independent.<br />
NOT AT ALL NOT<br />
VERY<br />
NEUTRAL IMPORTANT<br />
IMPORTANT IMPORTANT<br />
IMPORTANT<br />
TOTAL<br />
PUBLIC SCHOOL 1 1 1 5 1 9<br />
VOCATIONAL EDUC. 2 2 5 1 2 12<br />
HIGH SCHOOL 4 8 4 4 0 20<br />
SHORT HIGHER EDUC. 2 5 2 1 2 12<br />
MEDIUM HIGHER<br />
EDUC.<br />
11 12 15 11 2 51<br />
LONG HIGHER EDUC. 12 11 12 16 4 55<br />
TOTAL 32 39 39 38 11 159<br />
Table 3.2.54: Distribution of respondents by educational level according to their opinion about the importance of street design (lightning, pavement<br />
material, greenery, etc) in the decision to ride a bike.<br />
Out of the Table 3.2.54, the SPSS calculated the Chi2 to be 21,349 with a degree of freedom (df) 20 and the missing<br />
values are 4. P is bigger than 0,250. Therefore, the variables are independent.<br />
YES NO TOTAL<br />
PUBLIC SCHOOL 2 7 9<br />
VOCATIONAL EDUC. 2 10 12<br />
HIGH SCHOOL 4 16 20<br />
SHORT HIGHER EDUC. 2 10 12<br />
MEDIUM HIGHER EDUC. 5 46 51<br />
LONG HIGHER EDUC. 6 49 55<br />
TOTAL 21 138 159<br />
Table 3.2.51: Distribution of the respondents by educational level based on starting to<br />
ride a bike more often, or not, after the opening of Hans Broges Gade.<br />
Out of the Table 3.2.51, the SPSS calculated the Chi2 to be 2,462 with a degree of freedom (df) 5 and the missing<br />
values are 4. P is bigger than 0,250. Therefore, the variables are independent.<br />
NOT AT ALL<br />
NOT<br />
VERY<br />
NEUTRAL IMPORTANT<br />
IMPORTANT IMPORTANT<br />
IMPORTANT<br />
TOTAL<br />
01-20 YEARS 1 4 5 3 0 13<br />
21-30 YEARS 10 12 9 15 3 49<br />
31-40 YEARS 5 6 9 8 3 31<br />
41-50 YEARS 7 9 4 2 2 24<br />
51-60 YEARS 6 2 5 4 3 20<br />
61-90 YEARS 2 3 7 6 0 18<br />
TOTAL 31 36 39 38 11 155<br />
Table 3.2.55: Distribution of respondents by age groups according to their opinion about the importance of street design (lightning, pavement<br />
material, greenery, etc) in the decision to ride a bike.<br />
Out of the Table 3.2.55, the SPSS calculated the Chi2 to be 20,916 with a degree of freedom (df) 20 and the missing<br />
values are 8. P is bigger than 0,250. Therefore, the variables are independent<br />
YES NO TOTAL<br />
01-20 YEARS 2 11 13<br />
21-30 YEARS 9 40 49<br />
31-40 YEARS 4 27 31<br />
41-50 YEARS 1 23 24<br />
51-60 YEARS 2 18 20<br />
61-90 YEARS 2 16 18<br />
TOTAL 20 135 155<br />
Table 3.2.52: Distribution of the respondents by age groups based on starting to ride<br />
a bike more often, or not, after the opening of Hans Broges Gade.<br />
Out of the Table 3.2.52, the SPSS calculated the Chi2 to be 3,204 with a degree of freedom (df) 5 and the missing<br />
values are 8. P is bigger than 0,250. Therefore, the variables are independent.<br />
SOCIO-DEMOGRAPHICS AND OPINION ABOUT HANS BROGES GADE`S DESIGN SOLUTION<br />
BAD NEUTRAL GOOD VERY GOOD TOTAL<br />
MALE 2 15 39 13 69<br />
FEMALE 1 28 34 22 85<br />
TOTAL 3 43 73 35 154<br />
Table 3.2.56: Distribution of respondents by gender according to their opinion about the street design solutions (lightning,<br />
pavement material, greenery, etc) used in Hans Broges Gade.<br />
Out of the Table 3.2.56, the SPSS calculated the Chi2 to be 5,315 with a degree of freedom (df) 3 and the missing<br />
values are 9. P is between 0,250 and 0,100. Therefore, the variables are independent.<br />
108 109


