

Aalborg Universitet Bike Infrastructures Report Silva, Victor ... - VBN
Aalborg Universitet Bike Infrastructures Report Silva, Victor ... - VBN
Aalborg Universitet Bike Infrastructures Report Silva, Victor ... - VBN

Create successful ePaper yourself
Turn your PDF publications into a flip-book with our unique Google optimized e-Paper software.
TRANS. TO<br />
AND FROM<br />
WORK<br />
RECREA-<br />
TION/<br />
LEISURE<br />
VISIT<br />
FAMILY/<br />
FRIENDS<br />
PURCHA-<br />
SING/<br />
SHOPPING<br />
TRANS. TO<br />
AND FROM<br />
SCHOOL<br />
OTHERS<br />
TOTAL<br />
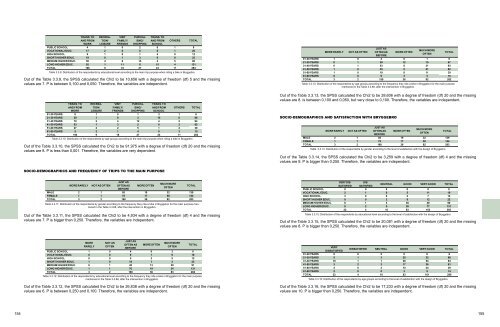
PUBLIC SCHOOL 4 1 0 2 0 1 8<br />
VOCATIONAL EDUC. 17 2 0 0 0 1 20<br />
HIGH SCHOOL 6 1 0 1 4 0 12<br />
SHORT HIGHER EDUC. 19 0 1 3 0 0 23<br />
MEDIUM HIGHER EDUC. 58 4 6 13 4 5 90<br />
LONG HIGHER EDUC. 92 1 11 8 15 4 131<br />
TOTAL 196 9 18 27 23 11 284<br />
Table 3.3.9: Distribution of the respondents by educational level according to the main trip purpose when riding a bike in Bryggebro.<br />
Out of the Table 3.3.9, the SPSS calculated the Chi2 to be 10,656 with a degree of freedom (df) 5 and the missing<br />
values are 7. P is between 0,100 and 0,050. Therefore, the variables are independent.<br />
TRANS. TO<br />
AND FROM<br />
WORK<br />
RECREA-<br />
TION/<br />
LEISURE<br />
VISIT<br />
FAMILY/<br />
FRIENDS<br />
PURCHA-<br />
SING/<br />
SHOPPING<br />
TRANS. TO<br />
AND FROM<br />
SCHOOL<br />
OTHERS<br />
TOTAL<br />
01-20 YEARS 0 1 0 1 3 1 6<br />
21-30 YEARS 39 1 8 3 15 0 66<br />
31-40 YEARS 70 2 4 12 4 2 94<br />
41-50 YEARS 53 1 3 2 0 3 62<br />
51-60 YEARS 27 2 2 5 1 2 39<br />
61-90 YEARS 5 2 1 4 0 3 15<br />
TOTAL 194 9 18 27 23 11 282<br />
Table 3.3.10: Distribution of the respondents by age groups according to the main trip purpose when riding a bike in Bryggebro<br />
Out of the Table 3.3.10, the SPSS calculated the Chi2 to be 91,975 with a degree of freedom (df) 20 and the missing<br />
values are 8. P is less than 0,001. Therefore, the variables are very dependent.<br />
MORE RARELY<br />
NOT AS OFTEN<br />
JUST AS<br />
OFTEN AS<br />
BEFORE<br />
MORE OFTEN<br />
MUCH MORE<br />
OFTEN<br />
Out of the Table 3.3.14, the SPSS calculated the Chi2 to be 3,259 with a degree of freedom (df) 4 and the missing<br />
values are 9. P is bigger than 0,250. Therefore, the variables are independent.<br />
TOTAL<br />
01-20 YEARS 1 0 4 0 1 6<br />
21-30 YEARS 0 1 39 12 15 67<br />
31-40 YEARS 0 1 53 8 31 93<br />
41-50 YEARS 1 0 35 5 21 62<br />
51-60 YEARS 1 0 19 8 11 39<br />
61-90 YEARS 0 0 9 3 3 15<br />
TOTAL 3 2 159 36 82 282<br />
Table 3.3.13: Distribution of the respondents by age groups according to the frequency they ride a bike in Bryggebro for the main purpose<br />
mentioned in the Table 3.3.68, after the intervention in Bryggebro.<br />
Out of the Table 3.3.13, the SPSS calculated the Chi2 to be 28,606 with a degree of freedom (df) 20 and the missing<br />
values are 8. is between 0,100 and 0,050, but very close to 0,100. Therefore, the variables are independent.<br />
SOCIO-DEMOGRAPHICS AND SATISFACTION WITH BRYGGEBRO<br />
MORE RARELY NOT AS OFTEN<br />
JUST AS<br />
MUCH MORE<br />
OFTEN AS MORE OFTEN<br />
OFTEN<br />
BEFORE<br />
TOTAL<br />
MALE 2 1 85 19 32 139<br />
FEMALE 1 1 75 17 50 144<br />
TOTAL 3 2 160 36 82 283<br />
Table 3.3.14: Distribution of the respondents by gender according to the level of satisfaction with the design of Bryggebro.<br />
SOCIO-DEMOGRAPHICS AND FREQUENCY OF TRIPS TO THE MAIN PURPOSE<br />
MORE RARELY<br />
NOT AS OFTEN<br />
JUST AS<br />
OFTEN AS<br />
BEFORE<br />
MORE OFTEN<br />
MUCH MORE<br />
OFTEN<br />
MALE 2 1 85 19 32 139<br />
FEMALE 1 1 75 17 50 144<br />
TOTAL 3 2 160 36 82 283<br />
Table 3.3.11: Distribution of the respondents by gender according to the frequency they ride a bike in Bryggebro for the main purpose mentioned<br />
in the Table 3.3.68, after the intervention in Bryggebro.<br />
Out of the Table 3.3.11, the SPSS calculated the Chi2 to be 4,934 with a degree of freedom (df) 4 and the missing<br />
values are 7. P is bigger than 0,250. Therefore, the variables are independent.<br />
TOTAL<br />
VERY DIS- DIS-<br />
SATISFIED SATISFIED<br />
NEUTRAL GOOD VERY GOOD TOTAL<br />
PUBLIC SCHOOL 0 0 0 0 8 8<br />
VOCATIONAL EDUC. 2 1 0 5 11 19<br />
HIGH SCHOOL 3 0 0 2 7 12<br />
SHORT HIGHER EDUC. 0 0 2 8 12 22<br />
MEDIUM HIGHER EDUC. 8 1 3 30 48 90<br />
LONG HIGHER EDUC. 9 2 5 38 77 131<br />
TOTAL 22 4 10 83 163 282<br />
Table 3.3.15: Distribution of the respondents by educational level according to the level of satisfaction with the design of Bryggebro.<br />
Out of the Table 3.3.15, the SPSS calculated the Chi2 to be 20,081 with a degree of freedom (df) 20 and the missing<br />
values are 8. P is bigger than 0,250. Therefore, the variables are independent.<br />
MORE<br />
RARELY<br />
NOT AS<br />
OFTEN<br />
JUST AS<br />
OFTEN AS<br />
BEFORE<br />
MORE OFTEN<br />
MUCH MORE<br />
OFTEN<br />
PUBLIC SCHOOL 1 0 4 0 3 8<br />
VOCATIONAL EDUC. 0 0 9 1 9 19<br />
HIGH SCHOOL 0 0 5 2 5 12<br />
SHORT HIGHER EDUC. 1 0 18 1 3 23<br />
MEDIUM HIGHER EDUC. 0 1 48 13 29 91<br />
LONG HIGHER EDUC. 1 1 76 19 34 131<br />
TOTAL 3 2 160 36 83 284<br />
Table 3.3.12: Distribution of the respondents by educational level according to the frequency they ride a bike in Bryggebro for the main purpose<br />
mentioned in the Table 3.3.68, after the intervention in Bryggebro.<br />
Out of the Table 3.3.12, the SPSS calculated the Chi2 to be 26,838 with a degree of freedom (df) 20 and the missing<br />
values are 6. P is between 0,250 and 0,100. Therefore, the variables are independent.<br />
TOTAL<br />
VERY<br />
DISSATISFIED<br />
DISSATISFIED NEUTRAL GOOD VERY GOOD TOTAL<br />
01-20 YEARS 0 0 0 0 6 6<br />
21-30 YEARS 5 1 3 25 32 66<br />
31-40 YEARS 10 1 1 28 54 94<br />
41-50 YEARS 3 2 3 17 36 61<br />
51-60 YEARS 2 0 3 10 24 39<br />
61-90 YEARS 2 0 0 3 9 14<br />
TOTAL 22 4 10 83 161 280<br />
Table 3.3.16: Distribution of the respondents by age groups according to the level of satisfaction with the design of Bryggebro.<br />
Out of the Table 3.3.16, the SPSS calculated the Chi2 to be 17,233 with a degree of freedom (df) 20 and the missing<br />
values are 10. P is bigger than 0,250. Therefore, the variables are independent.<br />
154 155


