

Aalborg Universitet Bike Infrastructures Report Silva, Victor ... - VBN
Aalborg Universitet Bike Infrastructures Report Silva, Victor ... - VBN
Aalborg Universitet Bike Infrastructures Report Silva, Victor ... - VBN

You also want an ePaper? Increase the reach of your titles
YUMPU automatically turns print PDFs into web optimized ePapers that Google loves.
INTERVIEW AND ELETRONIC<br />
CORRESPONDENCE WITH KEY<br />
ACTORS<br />
Through non-structured interviews and electronic correspondence,<br />
personal opinion and information about<br />
the studied infrastructures were also gathered from both<br />
technicians from the studies municipalities and cyclists.<br />
DATA ANALYSIS<br />
A data basis was developed in the Excel with all the interviews<br />
and questionnaires. This data base identifies relevant<br />
information to be used in the report. The interviews<br />
and electronic correspondence functioned as support information<br />
to the count figures and web survey findings.<br />
FIELD OBSERVATIONAL SURVEY AND IM-<br />
AGE COLLECTION<br />
Observation is a major source in the field research, the<br />
three infrastructures were analyzed in loco, local conditions<br />
during the day were observed and a diary was writing.<br />
The observation aimed to identify possible design<br />
characteristics of the infrastructures that may affect people’s<br />
traveling behavior.<br />
The design detail characteristics analyzed in loco were:<br />
infrastructure typology, pavement material and lay out,<br />
on-street parking facilities, priority signs at crossings, hierarchy<br />
of the modes of transport (pedestrians, cyclists,<br />
car drivers), traffic calming solutions, public art, signage,<br />
greenery, lightning (day and night) bicycle paths and<br />
lanes.<br />
DATA ANALYSIS<br />
An image data base was implemented and the material<br />
was used in several sections of the report to visually<br />
exemplify findings. Moreover, images took from the site<br />
were used to compare with the counting and illustrate the<br />
local conditions throughout the day.<br />
The descriptions from the diary were also a strategic data<br />
used to be compared with the count figures and the web<br />
survey findings.<br />
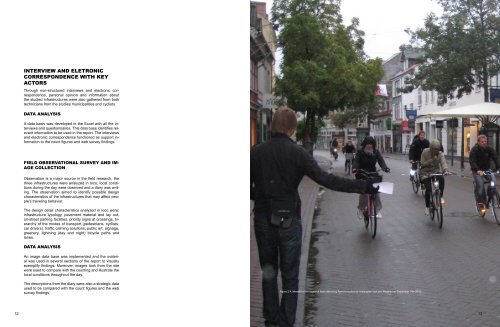
Figure 2.4: Member of the research team delivering flyers to cyclists at Vestergade Vest and Mageløs on September 14th 2010.<br />
12 13


