

Aalborg Universitet Bike Infrastructures Report Silva, Victor ... - VBN
Aalborg Universitet Bike Infrastructures Report Silva, Victor ... - VBN
Aalborg Universitet Bike Infrastructures Report Silva, Victor ... - VBN

Create successful ePaper yourself
Turn your PDF publications into a flip-book with our unique Google optimized e-Paper software.
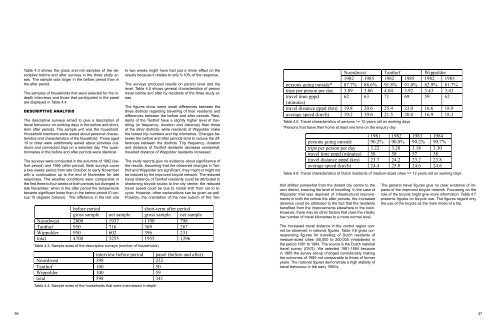
Table 4.3 shows the gross and net samples of the descriptive<br />
before and after surveys in the three study areas.<br />
The sample was larger in the before period than in<br />
the after period.<br />
The samples of households that were selected for the indepth<br />
interviews and those that participated in the panel<br />
are displayed in Table 4.4.<br />
Descriptive analysis<br />
The descriptive surveys aimed to give a description of<br />
travel behaviour on working days in the before and shortterm<br />
after periods. The sample unit was the household.<br />
Household members were asked about personal characteristics<br />
and characteristics of the household. Those aged<br />
10 or older were additionally asked about activities outdoors<br />
and connected trips on a selected day. The questionnaires<br />
in the before and after periods were identical.<br />
The surveys were conducted in the autumns of 1982 (before<br />
period) and 1985 (after period). Both surveys cover<br />
a two weeks period from late October to early November<br />
with a continuation up to the end of November for late<br />
responses. The weather conditions were comparable in<br />
the first three to four weeks of both periods but diverged in<br />
late November, when in the after period the temperature<br />
became significant lower than in the before period (0 versus<br />
10 degrees Celsius). The difference in the last one<br />
to two weeks might have had just a minor effect on the<br />
results because it relates to only 5-10% of the response.<br />
The surveys produced results on person level and trip<br />
level. Table 4.5 shows general characteristics of person<br />
travel before and after by residents of the three study areas.<br />
The figures show some small differences between the<br />
three districts regarding travelling of their residents and<br />
differences between the before and after periods. Residents<br />
of the Tanthof have a slightly higher level of travelling<br />
(in frequency, duration and distance) than those<br />
of the other districts, while residents of Wippolder make<br />
the lowest trip numbers and trip kilometres. Changes between<br />
the before and after periods tend to reduce the differences<br />
between the districts. Trip frequency, duration<br />
and distance of Tanthof residents decrease somewhat,<br />
travelled distance of Wippolder residents increased.<br />
The study reports give no evidence about significance of<br />
the results. Assuming that the observed changes in Tanthof<br />
and Wippolder are significant, they might or might not<br />
be induced by the improved bicycle network. The reduced<br />
travel distance of Tanthof residents could be attributed to<br />
shortening bicycle routes to the city centre; the reduced<br />
travel speed could be due to modal shift from car to bicycle.<br />
However, other explanations can be given as well.<br />
Possibly, the orientation of the new suburb of the Tanbefore<br />
period<br />
short-term after period<br />
gross sample net sample gross sample net sample<br />
Noordwest 2800 1937 1190 798<br />
Tanthof 950 716 369 267<br />
Wippolder 950 602 396 231<br />
total 4700 3255 1955 1296<br />
Table 4.3: Sample sizes of the descriptive surveys (number of households)<br />
interview before period panel (before and after)<br />
Noordwest 398 232<br />
Tanthof 100 50<br />
Wippolder 100 59<br />
total 598 341<br />
Table 4.4: Sample sizes of the households that were interviewed in-depth<br />
Noordwest Tanthof Wippolder<br />
1982 1985 1982 1985 1982 1985<br />
persons going outside* 87.7% 88.6% 91.8% 91.0% 82.9% 81.7%<br />
trips per person per day 3.89 3.86 4.04 3.92 3.43 3.43<br />
travel time pppd 62 63 71 69 59 62<br />
(minutes)<br />
travel distance pppd (km) 19.8 20.6 25.4 23.0 16.6 18.9<br />
average speed (km/h) 19.2 19.6 21.5 20.0 16.9 18.3<br />
Table 4.5: Travel characteristics of persons >= 10 years old on working days<br />
*Persons that leave their home at least one time on the enquiry day<br />
1981 1982 1983 1984<br />
persons going outside 90.2% 90.0% 90.2% 90.7%<br />
trips per person per day 3.22 3.20 3.18 3.30<br />
travel time pppd (minutes) 58 58 57 58<br />
travel distance pppd (km) 23.7 24.2 23.2 23.8<br />
average speed (km/h) 24.4 25.0 24.6 24.6<br />
Table 4.6: Travel characteristics of Dutch residents of medium-sized cities >= 12 years old on working days<br />
thof shifted somewhat from the distant city centre to the<br />
own district, lowering the level of travelling. In the case of<br />
Wippolder that was deprived of infrastructural improvements<br />
in both the before the after periods, the increased<br />
distance could be attributed to the fact that the residents<br />
benefited from the improvements elsewhere in the town.<br />
However, there may be other factors that raise the initially<br />
low number of travel kilometres to a more normal level.<br />
The increased travel distance in the control region cannot<br />
be observed in national figures. Table 4.6 gives corresponding<br />
figures for travelling of Dutch residents of<br />
medium-sized cities (50,000 to 200,000 inhabitants) in<br />
the period 1981 to 1984. The source is the Dutch national<br />
travel survey (OVG). We selected 1981-1984 because<br />
in 1985 the survey set-up changed considerably making<br />
the outcomes of 1985 not comparable to those of former<br />
years. The national figures demonstrate a high stability of<br />
travel behaviour in the early 1980’s.<br />
The general travel figures give no clear evidence of impacts<br />
of the improved bicycle network. Focussing on the<br />
role of the bicycle might give more information. Table 4.7<br />
presents figures on bicycle use. The figures regard only<br />
the use of the bicycle as the main mode of a trip.<br />
36 37


