Annual Report 2010 - Knorr-Bremse AG.
Annual Report 2010 - Knorr-Bremse AG.
Annual Report 2010 - Knorr-Bremse AG.

Create successful ePaper yourself
Turn your PDF publications into a flip-book with our unique Google optimized e-Paper software.
156 SEGMENT REPORT<br />
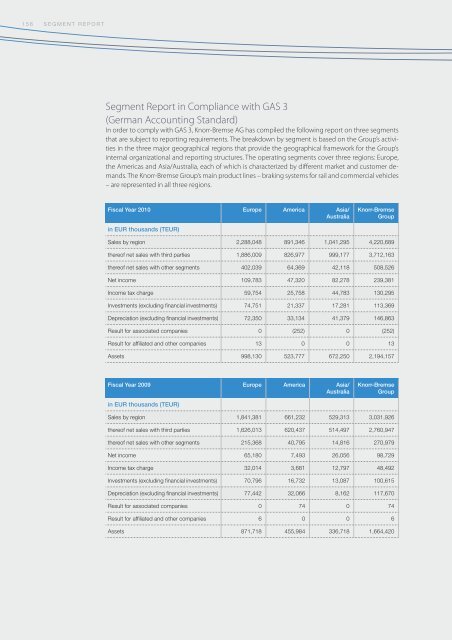
Segment <strong>Report</strong> in Compliance with GAS 3<br />
(German Accounting Standard)<br />
In order to comply with GAS 3, <strong>Knorr</strong>-<strong>Bremse</strong> <strong>AG</strong> has compiled the following report on three segments<br />
that are subject to reporting requirements. The breakdown by segment is based on the Group’s activities<br />
in the three major geographical regions that provide the geographical framework for the Group’s<br />
internal organizational and reporting structures. The operating segments cover three regions: Europe,<br />
the Americas and Asia/Australia, each of which is characterized by different market and customer demands.<br />
The <strong>Knorr</strong>-<strong>Bremse</strong> Group’s main product lines – braking systems for rail and commercial vehicles<br />
– are represented in all three regions.<br />
Fiscal Year <strong>2010</strong> Europe America Asia/<br />
Australia<br />
<strong>Knorr</strong>-<strong>Bremse</strong><br />
Group<br />
in EUR thousands (TEUR)<br />
Sales by region 2,288,048 891,346 1,041,295 4,220,689<br />
thereof net sales with third parties 1,886,009 826,977 999,177 3,712,163<br />
thereof net sales with other segments 402,039 64,369 42,118 508,526<br />
Net income 109,783 47,320 82,278 239,381<br />
Income tax charge 59,754 25,758 44,783 130,295<br />
Investments (excluding financial investments) 74,751 21,337 17,281 113,369<br />
Depreciation (excluding financial investments) 72,350 33,134 41,379 146,863<br />
Result for associated companies 0 (252) 0 (252)<br />
Result for affiliated and other companies 13 0 0 13<br />
Assets 998,130 523,777 672,250 2,194,157<br />
Fiscal Year 2009 Europe America Asia/<br />
Australia<br />
<strong>Knorr</strong>-<strong>Bremse</strong><br />
Group<br />
in EUR thousands (TEUR)<br />
Sales by region 1,841,381 661,232 529,313 3,031,926<br />
thereof net sales with third parties 1,626,013 620,437 514,497 2,760,947<br />
thereof net sales with other segments 215,368 40,795 14,816 270,979<br />
Net income 65,180 7,493 26,056 98,729<br />
Income tax charge 32,014 3,681 12,797 48,492<br />
Investments (excluding financial investments) 70,796 16,732 13,087 100,615<br />
Depreciation (excluding financial investments) 77,442 32,066 8,162 117,670<br />
Result for associated companies 0 74 0 74<br />
Result for affiliated and other companies 6 0 0 6<br />
Assets 871,718 455,984 336,718 1,664,420


![Geschäftsbericht 2012 [PDF, 13 MB] - Zelisko](https://img.yumpu.com/22524926/1/184x260/geschaftsbericht-2012-pdf-13-mb-zelisko.jpg?quality=85)