Groundwater in the Great Lakes Basin
Groundwater in the Great Lakes Basin
Groundwater in the Great Lakes Basin
You also want an ePaper? Increase the reach of your titles
YUMPU automatically turns print PDFs into web optimized ePapers that Google loves.
Apparent Losses<br />
Old meters are likely to blame for <strong>the</strong> majority of<br />
“apparent losses” (Kolker, 2007). As meters age <strong>the</strong>y<br />
slow down. For example, for every 100 litres that passes<br />
through only 90 litres may be measured, result<strong>in</strong>g <strong>in</strong><br />
an apparent loss of 10 litres. To compensate for water<br />
meter errors cities are forced to charge higher rates.<br />
Wyom<strong>in</strong>g, Michigan, is currently replac<strong>in</strong>g all residential<br />
meters at an estimated total cost of $1.8 million<br />
(Kolker, 2007). Also, <strong>in</strong> some older communities <strong>in</strong><br />
Chicago and Toronto houses are still not hooked up<br />
to a water meter. These communities pay a flat rate<br />
for <strong>the</strong>ir water services, not keep<strong>in</strong>g track of actual<br />
amounts used; or <strong>in</strong> some extreme cases <strong>the</strong>y may be<br />
pay<strong>in</strong>g noth<strong>in</strong>g at all. Meter<strong>in</strong>g has many advantages<br />
<strong>in</strong>clud<strong>in</strong>g <strong>the</strong> <strong>in</strong>centive for customers to conserve<br />
water, provid<strong>in</strong>g <strong>in</strong>formation regard<strong>in</strong>g water leakage<br />
between <strong>the</strong> plant and customer, allow<strong>in</strong>g for better<br />
use of repair and ma<strong>in</strong>tenance resources and improv<strong>in</strong>g<br />
accountability (Kitchen, 2007).<br />
A study to determ<strong>in</strong>e <strong>the</strong> percent of unmetered water<br />
with<strong>in</strong> <strong>the</strong> <strong>Great</strong> <strong>Lakes</strong> – St. Lawrence River bas<strong>in</strong><br />
was undertaken by Sereres. Water meter<strong>in</strong>g <strong>in</strong>formation<br />
was ga<strong>the</strong>red from 15 cities (7 Canadian and<br />
8 American) of vary<strong>in</strong>g population size. The study<br />
showed that as population and city size <strong>in</strong>creases <strong>the</strong><br />
percent of residential metered water tends to decrease<br />
(Figure 2) (Sereres, 2006). See Table 2 for water<br />
meter<strong>in</strong>g data of <strong>in</strong>dividual cities.<br />
Not only do leaks result <strong>in</strong> water loss but also <strong>in</strong><br />
economic loss as raw water, treatment and transportation<br />
are costly. Cities are los<strong>in</strong>g millions from pipes<br />
leak<strong>in</strong>g treated water (Javed, 2007). In Toronto <strong>the</strong> exact<br />
percent of water loss is still uncerta<strong>in</strong>, rang<strong>in</strong>g from an<br />
estimate of 7%, by Toronto’s works and <strong>in</strong>frastructure<br />
committee chairman, to 25%, by <strong>the</strong> Ontario Sewer<br />
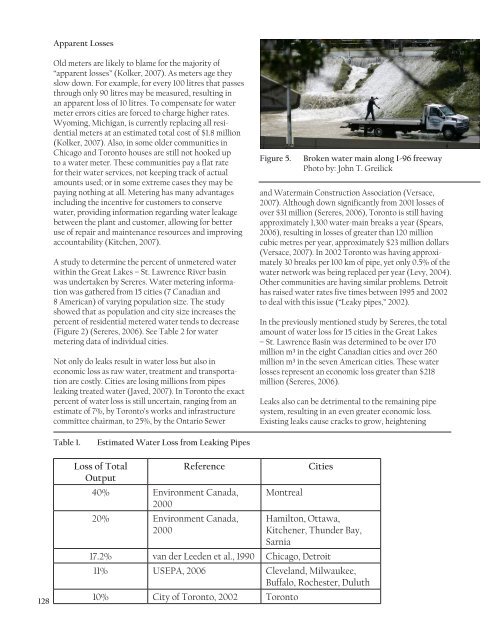
Figure 5.<br />
Broken water ma<strong>in</strong> along I-96 freeway<br />
Photo by: John T. Greilick<br />
and Waterma<strong>in</strong> Construction Association (Versace,<br />
2007). Although down significantly from 2001 losses of<br />
over $31 million (Sereres, 2006), Toronto is still hav<strong>in</strong>g<br />
approximately 1,300 water-ma<strong>in</strong> breaks a year (Spears,<br />
2006), result<strong>in</strong>g <strong>in</strong> losses of greater than 120 million<br />
cubic metres per year, approximately $23 million dollars<br />
(Versace, 2007). In 2002 Toronto was hav<strong>in</strong>g approximately<br />
30 breaks per 100 km of pipe, yet only 0.5% of <strong>the</strong><br />
water network was be<strong>in</strong>g replaced per year (Levy, 2004).<br />
O<strong>the</strong>r communities are hav<strong>in</strong>g similar problems. Detroit<br />
has raised water rates five times between 1995 and 2002<br />
to deal with this issue (“Leaky pipes,” 2002).<br />
In <strong>the</strong> previously mentioned study by Sereres, <strong>the</strong> total<br />
amount of water loss for 15 cities <strong>in</strong> <strong>the</strong> <strong>Great</strong> <strong>Lakes</strong><br />
– St. Lawrence Bas<strong>in</strong> was determ<strong>in</strong>ed to be over 170<br />
million m³ <strong>in</strong> <strong>the</strong> eight Canadian cities and over 260<br />
million m³ <strong>in</strong> <strong>the</strong> seven American cities. These water<br />
losses represent an economic loss greater than $218<br />
million (Sereres, 2006).<br />
Leaks also can be detrimental to <strong>the</strong> rema<strong>in</strong><strong>in</strong>g pipe<br />
system, result<strong>in</strong>g <strong>in</strong> an even greater economic loss.<br />
Exist<strong>in</strong>g leaks cause cracks to grow, heighten<strong>in</strong>g<br />
Table 1.<br />
Estimated Water Loss from Leak<strong>in</strong>g Pipes<br />
128<br />
Loss of Total<br />
Reference<br />
Output<br />
40% Environment Canada,<br />
2000<br />
20% Environment Canada,<br />
2000<br />
Montreal<br />
Cities<br />
Hamilton, Ottawa,<br />
Kitchener, Thunder Bay,<br />
Sarnia<br />
17.2% van der Leeden et al., 1990 Chicago, Detroit<br />
11% USEPA, 2006 Cleveland, Milwaukee,<br />
Buffalo, Rochester, Duluth<br />
10% City of Toronto, 2002 Toronto


