Certified Proof Manual - image2output - Support
Certified Proof Manual - image2output - Support
Certified Proof Manual - image2output - Support

You also want an ePaper? Increase the reach of your titles
YUMPU automatically turns print PDFs into web optimized ePapers that Google loves.
Reports<br />
Data Table<br />
http://www.<strong>image2output</strong>.com<br />
You can continue working with the main window while the REPORT<br />
dialog is open. When you click on the color bar in the main window<br />
(see page 3-6), the table row corresponding to the selected patch is<br />
highlighted. Likewise, when you click on a table row, the corresponding<br />
patch on the color bar is underlined in black.<br />
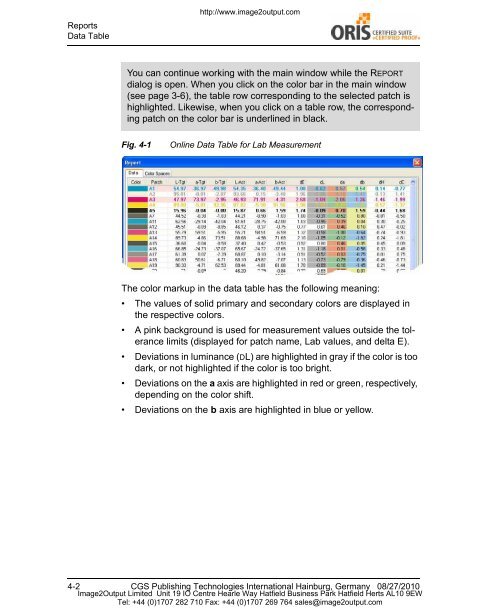
Fig. 4-1<br />
Online Data Table for Lab Measurement<br />
The color markup in the data table has the following meaning:<br />
• The values of solid primary and secondary colors are displayed in<br />
the respective colors.<br />
• A pink background is used for measurement values outside the tolerance<br />
limits (displayed for patch name, Lab values, and delta E).<br />
• Deviations in luminance (DL) are highlighted in gray if the color is too<br />
dark, or not highlighted if the color is too bright.<br />
• Deviations on the a axis are highlighted in red or green, respectively,<br />
depending on the color shift.<br />
• Deviations on the b axis are highlighted in blue or yellow.<br />
4-2 CGS Publishing Technologies International Hainburg, Germany 08/27/2010<br />
Image2Output Limited Unit 19 IO Centre Hearle Way Hatfield Business Park Hatfield Herts AL10 9EW<br />
Tel: +44 (0)1707 282 710 Fax: +44 (0)1707 269 764 sales@<strong>image2output</strong>.com