Certified Proof Manual - image2output - Support
Certified Proof Manual - image2output - Support
Certified Proof Manual - image2output - Support

You also want an ePaper? Increase the reach of your titles
YUMPU automatically turns print PDFs into web optimized ePapers that Google loves.
http://www.<strong>image2output</strong>.com<br />
Long-Term Control and Trend Analysis<br />
‘Trend Analysis’ Dialog<br />
C<br />
M<br />
Y<br />
K<br />
PW<br />
Max<br />
Ø<br />
dH Max<br />
dH Ø<br />
Gray<br />
Gray Ø<br />
Skin<br />
Skin Ø<br />
Delta E of cyan<br />
Delta E of magenta<br />
Delta E of yellow<br />
Delta E of black<br />
Delta E of paper white<br />
Maximum delta E<br />
Average delta E<br />
Maximum delta H of primary colors (absolute values)<br />
Average delta H of CMY gray (G10–G100)<br />
Maximum delta E of gray tones<br />
Average delta E of gray tones<br />
Maximum delta E of skin tones<br />
Average delta E of skin tones<br />
Use the TOLERANCES option to display the tolerance limits. They are represented<br />
as dashed lines in the color of the respective delta E curves.<br />
This option is only available if the same standard tolerances were used<br />
for all of the selected measurements.<br />
Delta H curves are only displayed if measurements with ‘ISO 12647-7<br />
color bar’ tolerances are selected (see page 8-7). Delta H values are<br />
always displayed as positive numbers, even if they are negative.<br />
Curves for gray and skin tones are only displayed if measurements<br />
with SICOGIF tolerances have been selected.<br />
Zooming In<br />
By default, the scale used for the y-axis is set such that all delta E curves<br />
are completely visible. To closely inspect lower delta E values, you can<br />
set the maximum delta E value displayed on the y-axis to a lower value.<br />
Select this value from the list titled MAX DE AXIS. The diagram becomes<br />
more detailed, since more intermediate delta E values are displayed.<br />
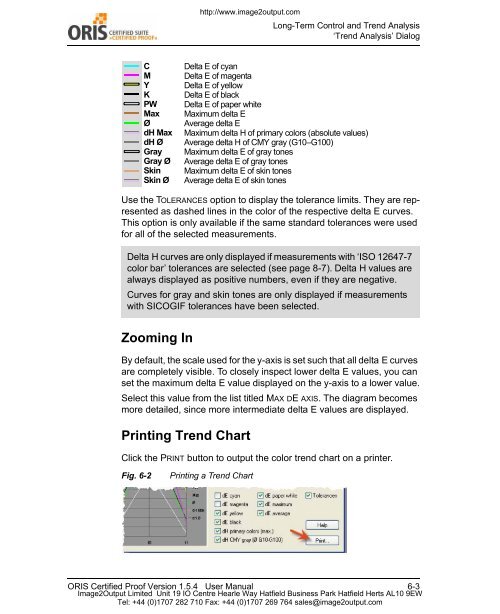
Printing Trend Chart<br />
Click the PRINT button to output the color trend chart on a printer.<br />
Fig. 6-2<br />
Printing a Trend Chart<br />
ORIS <strong>Certified</strong> <strong>Proof</strong> Version 1.5.4 User <strong>Manual</strong> 6-3<br />
Image2Output Limited Unit 19 IO Centre Hearle Way Hatfield Business Park Hatfield Herts AL10 9EW<br />
Tel: +44 (0)1707 282 710 Fax: +44 (0)1707 269 764 sales@<strong>image2output</strong>.com