Certified Proof Manual - image2output - Support
Certified Proof Manual - image2output - Support
Certified Proof Manual - image2output - Support

You also want an ePaper? Increase the reach of your titles
YUMPU automatically turns print PDFs into web optimized ePapers that Google loves.
Reports<br />
Color Space Diagram<br />
http://www.<strong>image2output</strong>.com<br />
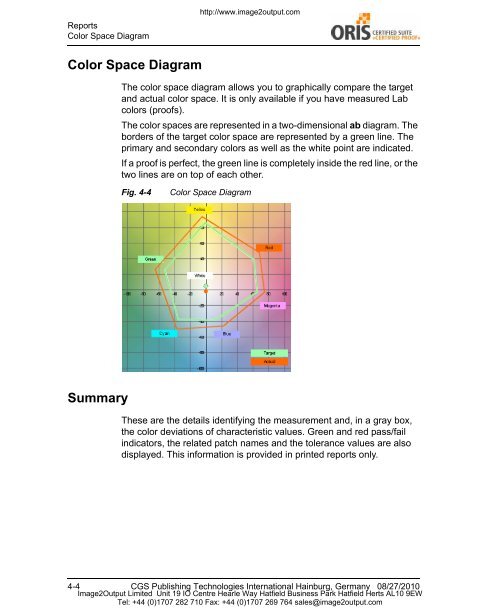
Color Space Diagram<br />
The color space diagram allows you to graphically compare the target<br />
and actual color space. It is only available if you have measured Lab<br />
colors (proofs).<br />
The color spaces are represented in a two-dimensional ab diagram. The<br />
borders of the target color space are represented by a green line. The<br />
primary and secondary colors as well as the white point are indicated.<br />
If a proof is perfect, the green line is completely inside the red line, or the<br />
two lines are on top of each other.<br />
Fig. 4-4<br />
Color Space Diagram<br />
Summary<br />
These are the details identifying the measurement and, in a gray box,<br />
the color deviations of characteristic values. Green and red pass/fail<br />
indicators, the related patch names and the tolerance values are also<br />
displayed. This information is provided in printed reports only.<br />
4-4 CGS Publishing Technologies International Hainburg, Germany 08/27/2010<br />
Image2Output Limited Unit 19 IO Centre Hearle Way Hatfield Business Park Hatfield Herts AL10 9EW<br />
Tel: +44 (0)1707 282 710 Fax: +44 (0)1707 269 764 sales@<strong>image2output</strong>.com