

RESEARCH· ·1970·
RESEARCH· ·1970·
RESEARCH· ·1970·

You also want an ePaper? Increase the reach of your titles
YUMPU automatically turns print PDFs into web optimized ePapers that Google loves.
B182<br />
ANALYTICAL METHODS<br />
in the aqueous layer that quench the fluorescence of. the<br />
carbonate-fluoride phosphor. Pipet a 2-ml aliquot of the<br />
ethyl acetate into a 7-ml platinum dish of the dimensions<br />
given by Grimaldi, May, Fletcher, and Titcomb<br />
(1954, p. 103). Place the dish in a shallow pan that contains<br />
about one-eighth of an inch of water to keep the<br />
bottom of the dish cool. Ignite the ethyl acetate with a<br />
lighted taper and aJllow the ethyl acetate to burn completely.<br />
Dry the residue remaining in the platinum dish<br />
on a steam bath, then heat the dish briefly over an open<br />
flame, below a red heat; to. remove any free nitric ·acid<br />
and organic matter in the residue before adding flux.<br />
The flux is -a carbonate-fluoride mixture that contains<br />
by weight 45.5 parts of sodium carbonate, 45.5 parts of<br />
potassium carbonate, and 9 parts of sodium fluoride.<br />
Two g of this flux are added to the residue in the platinum<br />
dish. Heat the dish over a burner at a low temperature<br />
until the flux melts. Then heat for an additional<br />
minute to keep the flux a little above the melting point,<br />
whi.le swirling the flux to dissolve all the uranium and<br />
to obtain a uniform melt. Set the dish on a level Alundum<br />
plate to cool. Measure the fluorescence of the phosphor<br />
with a transmission fluorimeter· such as that described<br />
by Kinser ( 1954). Determine the uranium in<br />
parts per million by reference to a standard curve.<br />
Standardization<br />
Standards containing 0.0 0.025, 0.050, 0.2, and 0.5 p.g<br />
of uranium are included with each set of samples, after<br />
the step of the addition of nitric rucid, and carried<br />
through all subsequent steps, to prepare working curves<br />
and to correct for small time-distributed changes that<br />
may occur. Two linear working curves covering two<br />
scales of the fluorimeter are used. One curve ranges from<br />
0.0 to 0.05 p.g uranium and the dther from 0.0 to 0.5 p.g.<br />
STUDY OF PRECISION<br />
Many determinations of uranium in plants collected<br />
during the season 1954-55 were made on two separate<br />
portions of ash from the same ashed sample. As a<br />
routine checking procedure, samples so duplicated included<br />
all those for which the first value obtained<br />
exceeded 1.0 ppm uranium and a considerable number,<br />
randomly selected, below this value. An equation (standard<br />
deviation =.15+0.0063 U, where U ~s ·the observed<br />
uranium concentration in parts per million) based on<br />
326 duplicate determinations allows the precision of<br />
other routine determinations to be predicted with<br />
considerable assurance, if analyses are made by the<br />
described method.<br />
The possibility that the precision of the uranium<br />
determination might be different for different plant<br />
species was first studied. The four species of plants<br />
studied were Artemisia sp? (sagebrush), Pinus edulis<br />
(pinon pine), Juniperus sp? (juniper), and Pinus ponderosa<br />
(ponderosa pine). The duplicate uranium determinations<br />
were collected for each species and subdivided<br />
into statistical classes, the ranges of which are<br />
given in table 1; then the arithmetic means, variances,<br />
and standard deviations were calculated. The equation<br />
used in calculating the variances (V) was<br />
'};d2<br />
V=- 2n<br />
where d is the difference between the duplicate determinations<br />
for each sample and n is the number of paired<br />
determinations.<br />
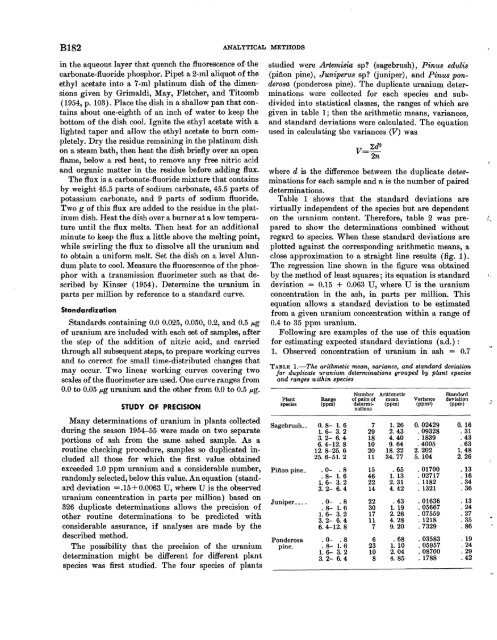
Table 1 shows that the standard deviations are<br />
virtually independent of the species but are dependent<br />
on the uranium content. Therefore, table 2 was prepared<br />
to show the determinations combined without<br />
regard to species. When these standard deviations are<br />
plotted against the corresponding arithmetic means, a<br />
close approximation to a straight line results (fig. 1).<br />
The regression line shown in the figure was obtained<br />
by the method of least squares; its equation is standard<br />
deviation = 0.15 + 0.063 U, where U is the uranium<br />
concentration in the ash, in parts per million. This<br />
equation allows a standard deviation to be estimated<br />
from a given uranium concentration within a range of<br />
0.4 to 35 ppm uranium.<br />
Following are examples of the use of this equation<br />
for estimating expected standard deviations ( s.d.) :<br />
1. Observed concentration of uranium in ash = 0.7<br />
TABLE 1.-The arithmetic mean, variance, and standard deviation<br />
for duplicate uranium determinations grouped by plant species<br />
and ranges within species<br />
Plant<br />
species<br />
Sagebrush __<br />
Pinon pine_<br />
Juniper ___ _<br />
Ponderosa<br />
pine.<br />
Range<br />
(ppm)<br />
0. 8- 1. 6<br />
1. 6- 3. 2<br />
3. 2- 6. 4<br />
6. 4-12. 8<br />
12. 8-25. 6<br />
25. 6-51. 2<br />
. 0- . 8<br />
. 8- 1. 6<br />
1. 6- 3. 2<br />
3. 2- 6.4<br />
. 0- . 8<br />
. 8- 1. 6<br />
1. 6- 3. 2<br />
3. 2- 6. 4<br />
6.4-12.8<br />
. 0- . 8<br />
. 8- 1. 6<br />
1. 6- 3. 2<br />
3. 2- 6.4<br />
Number Arithmetic<br />
or pairs or mean Variance<br />
determi- (ppm) (ppma)<br />
nations<br />
7 1. 26 0. 02429<br />
29 2.43 . 09328<br />
18 4.40 . 1839<br />
10 9. 64 . 4005<br />
20 18. 22 2. ·202<br />
11 34. 77 5. 104<br />
15 . 65 . 01700<br />
46 1. 13 . 02717<br />
22 2. 31 . 1182<br />
14 4. 42 . 1321<br />
22 . 43 . 01636<br />
30 1. 19 . 05667<br />
17 2. 26 . 07559<br />
11 4. 28 . 1218<br />
7 9. 20 . 7329<br />
6 . 68 . 03583<br />
23 1. 10 . 05957<br />
10 2. 04 . 08700<br />
8 4. 85 . 1788<br />
Standard<br />
deviation<br />
(ppm)<br />
0. 16<br />
. 31<br />
. 43<br />
. 63<br />
1. 48<br />
2. 26<br />
. 13<br />
. 16<br />
. 34<br />
. 36<br />
. 13<br />
. 24<br />
. 27<br />
. 35<br />
. 86<br />
. 19<br />
. 24<br />
. 29<br />
. 42<br />
1 .•


