

RESEARCH· ·1970·
RESEARCH· ·1970·
RESEARCH· ·1970·

You also want an ePaper? Increase the reach of your titles
YUMPU automatically turns print PDFs into web optimized ePapers that Google loves.
..;<br />
ppm. Then U = 0.7 and s.d. = ·o.15 + (0.063) (0.7)<br />
= 0.19 ppm, or the expected standard deviation<br />
would be about 0.2 ppm, and the expected coefficient<br />
of variation would be 27 percent after rounding.<br />
TABLE 2.-The arithmetic mean and standard deviation for duplicate<br />
uranimn determinations grouped by ranges regardless of<br />
plant species<br />
Number of pnlrs of dotcrmlnntlons<br />
43 _____________________ _<br />
106 ____________________ _<br />
78----------------------<br />
51 _____________________ _<br />
17 _____________________ _<br />
20 _____________________ _<br />
11 _____________________ _<br />
z 3.0<br />
0<br />
::i<br />
..J<br />
:::E 2.5<br />
0:<br />
w<br />
Q..<br />
~ 2.0<br />
0:<br />
~<br />
~ 1.5<br />
z<br />
0<br />
i=<br />
=:; 1.0<br />
> w<br />
0<br />
~ 0.5<br />
c(<br />
0<br />
z<br />
c(<br />
1-<br />
rn<br />
0 5 10 15<br />
Rnngc (ppm)<br />
0. 0- 0. 8<br />
. 8- 1. 6<br />
1. 6- 3. 2<br />
3. 2- 6. 4<br />
6. 4-12. 8<br />
12. 8-25. 6<br />
25. 6-51. 2<br />
Arithmetic<br />
menn<br />
(ppm)<br />
0. 54<br />
1. 15<br />
2. 31<br />
4. 45<br />
9.46<br />
18. 22<br />
34. 77<br />
Regression line<br />
Standard deviation in parts per<br />
million= 0.15 + 0.063 X uranium<br />
concentration (For range 0.4 to<br />
35 ppm)<br />
HUFFMAN AND RILEY<br />
Standard<br />
deviation<br />
(ppm)<br />
0. 14<br />
. 21<br />
. 31<br />
. 39<br />
. 73<br />
1. 48<br />
2. 26<br />
20 25 30 35 40<br />
URANIUM CONCENTRATION IN PLANT ASH,<br />
IN PARTS PER MILLION<br />
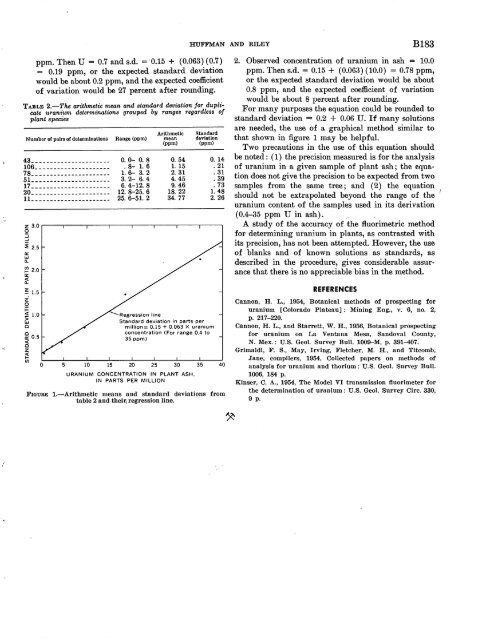
FIGURE 1.-Arlthmetlc means and standard deviations from<br />
table 2 and their 1 re~ression line.<br />
B183<br />
2. Observed concentration of uranium in ash = 10.0<br />
ppm. Then s.d. = 0.15 + ( 0.063) ( 10.0) = 0.78 ppm,<br />
or the expected standard deviation would be about<br />
0.8 ppm, and the expected coefficient of variation<br />
would be about 8 percent after rounding.<br />
For many purposes the equation could be rounded to<br />
standard deviation = 0.2 + 0.06 U. If ·m!Mly solutions<br />
are needed, the use of a graphical method similar to<br />
that shown in figure 1 may be helpful.<br />
Two precautions in the use of this equation should<br />
be noted : ( 1) the precision measured is for the analysis<br />
of uranium in a given sample of plant ash; the equation<br />
does not give the precision to be expected from two<br />
samples from the same tree; and (2) the equation<br />
should not be extra pol a ted beyond the range of the<br />
uranium content of the samples used in its derivation<br />
(0.4-35 ppm U in ash). ..<br />
A study of the accuracy of the fluorimetric method<br />
for determining uranium in plants, as contrasted with<br />
its precision, has not been attempted. However, the use<br />
of blanks and of known solutions as standards, as<br />
described in the procedure, gives considerable assurance<br />
that there is no appreciable bias in the m~thod.<br />
REFERENCES<br />
Cannon, H. L., 1954, Botanical methods of prospecting for<br />
uranium [Colorado Plateau]: Mining Eng., v. 6, no. 2,<br />
p. 217-220.<br />
Cannon, H. L., and Starrett, W. H., 1956, Botanical prospecting<br />
for uranium on r. .. a Ventana Mesa, Sandoval County,<br />
N. Mex. : U.S. Geol. Survey Bull. 1009-M, p. 391-407.<br />
Grimaldi, F. S., May, Irving, }~letcher, M. H., and Titcomb,<br />
Jane, compilers, 1954, Collected papers on methods of<br />
analysis for uranium and thorium: U.S. Geol. Survey Bull.<br />
1006, 184 p.<br />
Kinser, C. A., 1954, The Model VI transmission fluorimeter for<br />
the determination of uranium: U.S. Geol. Survey Circ. 330,<br />
9 p.<br />
· ..


