

RESEARCH· ·1970·
RESEARCH· ·1970·
RESEARCH· ·1970·

You also want an ePaper? Increase the reach of your titles
YUMPU automatically turns print PDFs into web optimized ePapers that Google loves.
GROSSMAN<br />
B207<br />
40<br />
cr:<br />
LIJ 35<br />
....<br />
::::;<br />
cr:<br />
LIJ<br />
Q.<br />
en<br />
:I<br />
c<br />
cr:<br />
(!)<br />
2 ....<br />
z<br />
4 ~<br />
(!)<br />
6 z<br />
ir<br />
8 :::l<br />
en<br />
10 ~<br />
~<br />
12 ~<br />
0<br />
..J<br />
14 LIJ<br />
IXl<br />
::::;<br />
..J<br />
i<br />
16<br />
....<br />
~<br />
LJ<br />
z<br />
LIJ 20<br />
cr:<br />
en<br />
~<br />
en<br />
c(<br />
z 15<br />
0<br />
Ill<br />
cr:<br />
.g·.<br />
LIJ<br />
LIJ<br />
.....<br />
18<br />
~<br />
Water level in_....<br />
20 _j<br />
well NSn 25<br />
LIJ.<br />
\<br />
\ (in till) ><br />
22 LIJ<br />
\<br />
..J<br />
24 cr:<br />
\ LIJ<br />
\<br />
\<br />
\<br />
\<br />
\<br />
' '<br />
cr: 10<br />
',........-Styrene depletion<br />
0<br />
><br />
', curve<br />
::r<br />
,,<br />
..J<br />
c<br />
.... ,<br />
....<br />
..........<br />
0<br />
....<br />
5<br />
............<br />
4<br />
...............<br />
3<br />
2<br />
1<br />
0 J FMAMJJASONDJ FMAMJJASONDJ FMAMJJASOND<br />
1 962 1963 1964<br />
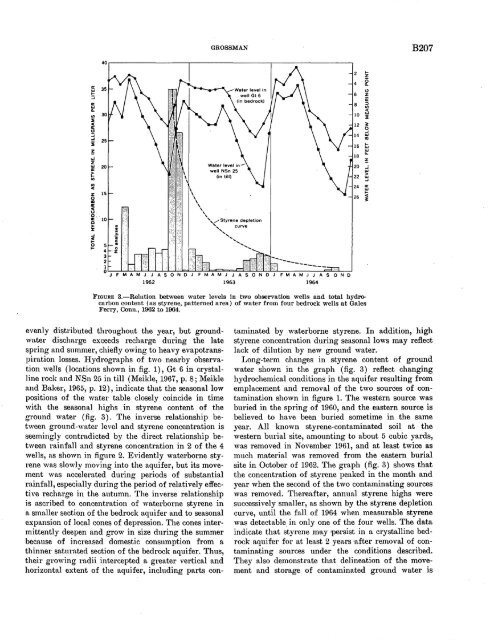
FIGURE 3.-Relation between water levels in two observation wells and total hydrocarbon<br />
content (as styrene, patterned area) of water from four bedrock wells at Gales<br />
Ferry, Ooom., 1962 to 1964.<br />
26<br />
....<br />
c(<br />
~<br />
evenly distributed throughout the year, but groundwater<br />
discharge exceeds recharge during the late<br />
spring and summer, chiefly owing to heavy evapotranspiration<br />
losses. I-Iydrographs of two nearby observation<br />
wells (locations shown in fig. 1), Gt 6 in crystalline<br />
rock and NSn 25 in till (l\1eikle, 1967, p. 8; Meikle<br />
and Baker, 1965, p. 12), indicate that the seasonal low<br />
positions of the water table closely coincide in time<br />
with the seasonal highs in styrene content of the<br />
ground water (fig. 3). The inverse relationship between<br />
ground-water level and styrene concentration is<br />
seemingly contradicted by the direct relationship between<br />
rainfnll nnd styrene concentration in 2 of the 4<br />
wells, as shown in figure 2. Evidently waterborne styrene<br />
was slowly moving into the aquifer, but its movement<br />
wns accelerated during periods of substantial<br />
rainfall, especially during the period of relatively effective<br />
recharge in the autumn. The inverse relationship<br />
is ascribed to concentration of waterborne styrene in<br />
a smaller section of the bedrock aquifer and to seasonal<br />
expansion of local cones of depression. The cones intermittently<br />
deepen and grow in size during the summer<br />
beb1use of increased domestic consumption from a<br />
thinner saturated section of the bedrock aquifer. Thus,<br />
their growing radii intercepted a greater vertical and<br />
horizontal extent of the aquifer, including parts contaminated<br />
by waterborne styrene. In addition, high<br />
styrene concentration during seasonal lows may reflect<br />
lack of dilution by new ground water.<br />
Long-term changes in styrene content of ground<br />
water shown in the graph (fig. 3) reflect changing<br />
hydrochemical conditions in the aquifer resulting from<br />
emplacement and removal of the two sources of contamination<br />
shown in figure 1. The western source was<br />
buried in the spring of 1960, and the eastern sourc~ is<br />
believed to have been buried sometime in the same<br />
year. All known styrene-contaminated soil at the<br />
western burial site, amounting to about 5 cubic yards,<br />
was removed in November 1961, and at least twice as<br />
much material was removed from the eastern burial<br />
site in October of 1962. The graph (fig. 3) shows that<br />
the concentration of styrene peaked in the month and<br />
year when the second of the two contaminating sources<br />
was r~moved. Thereafter, annual styrene highs were<br />
successively smaller, as shown by the styrene depletion<br />
curve, until the fall of 1964 when measurable styrene<br />
was detectable. in only one of the four wells. The data<br />
indicate that styrene Jnay persist in a crystalline bedrock<br />
aquifer for at lea.st 2 years •after removal of con<br />
1<br />
taminating sources under the conditions described.<br />
They also demonstrate that delineation of the movement<br />
and storage of contaminated ground water is


