

RESEARCH· ·1970·
RESEARCH· ·1970·
RESEARCH· ·1970·

Create successful ePaper yourself
Turn your PDF publications into a flip-book with our unique Google optimized e-Paper software.
B198<br />
GROUND-WATER RECHARGE<br />
the basin probably is only a few inches thick, is considered<br />
negligible. ~1oreover, numerous other complex<br />
factors associated with flow through the zone of aeration<br />
are deliberately disregarded and, as a result, the<br />
term "apparent rate of movement" is used to describe<br />
the observations considered in this report.<br />
RESULTS AND COINCLUSIONS<br />
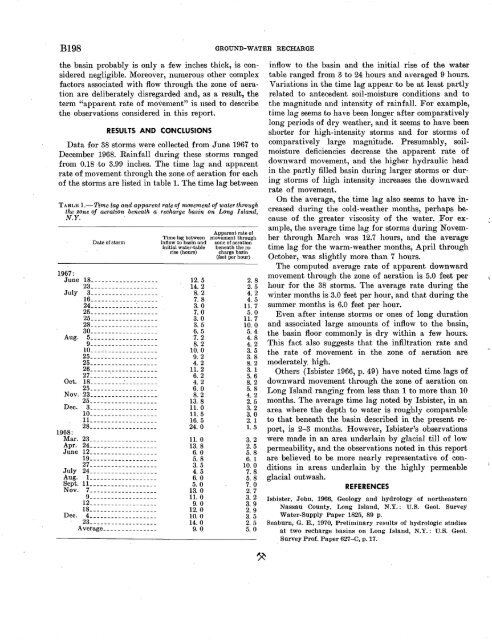
Data for 38 storms were collected from June 1967 to<br />
December 1968. Rainfall· during these storms ranged<br />
from 0.18 to 3.99 inches. The time lag and apparent<br />
rate of movement through the zone .of aeration for each<br />
of the storms are listed in table 1. The time lag between<br />
TABLE 1.-Time lag and apparent rate of movement of water through<br />
the zone of aeration beneath a recharge basin on Long Island,<br />
N.Y. ·<br />
Date of storm<br />
1967:<br />
June 18 __________________ _<br />
23 __________________ _<br />
July 3--~---------------~<br />
16 __________________ _<br />
Aug.<br />
25 24.~----------~------<br />
__________________ _<br />
25 __________________ _<br />
28 __________________ _<br />
30 __________________ _<br />
5 __________________ _<br />
9-------------------<br />
25 10 __________________ ... ~~--------------_<br />
25 __________________ _<br />
26·------~~----------<br />
27 _____ ~-------------<br />
Oct. 18 ________ _..: __ :.. _____ 25 __________________ _<br />
~ov. 23 __________________ _<br />
25 __________________ _<br />
I>ec. 3 __________________ _<br />
1968:<br />
~ar.<br />
10--------------~--~-<br />
11 __________________ _<br />
28 __________________ _<br />
23 __________________ _<br />
Ap~ 24 __ ~-~--------------<br />
June 12 __________________ _<br />
19 __________________ _<br />
July 24 27---------~---------<br />
__________________ _<br />
Aug. 1 __________________ _<br />
Sept. 11 __________________ _<br />
~ov. 7 __________________ 9 __________________ _<br />
12 __________________ _<br />
18 __________________ _<br />
I>ec. 4 __________________ _<br />
23 __________________ _<br />
Average ______________ _<br />
Apparent rate of<br />
Time lag between movement through<br />
inflow to basin and zone of aeration<br />
initial water-table beneath the rerise<br />
(hours) charge basin<br />
(feet per hour)<br />
12. 5 2. 8<br />
14. 2 2. 5<br />
8. 2 4. 2<br />
7. 8 4. 5<br />
3. 0 11. 7<br />
7. 0 5. 0<br />
3. 0 11. 7<br />
3. 5 10. 0<br />
6. 5 5. 4<br />
7. 2 4. 8<br />
8. 2 4. 2<br />
10. 0 3. 5<br />
9. 2 3. 8<br />
4. 2 8. 2<br />
11. 2 3. 1<br />
6. 2 5. 6<br />
4. 2 8. 2<br />
6. 0 5. 8<br />
8. 2 4. 2<br />
13. 8 2. 5<br />
11. 0 3. 2<br />
11.5 3. 0<br />
16. 5 2. 1<br />
24. 0 1.5<br />
11.0 3. 2<br />
13. 8 2. 5<br />
6. 0 5. 8<br />
5. 8 6. 1<br />
3. 5 10. 0<br />
4. 5 7. 8<br />
6. 0 5. 8<br />
5. 0 7. 0<br />
13. 0 2. 7<br />
11. 0 3. 2<br />
9. 0 3. 9<br />
12.0 2. 9<br />
10. 0 3. 5<br />
14. 0 2. 5<br />
9. 0. 5. 0<br />
inflow to the basin and the initial rise of the water<br />
table ranged from 3 to 24 hours and average~ 9 hours.<br />
V aria.tions in the time lag appear to be -at least partly<br />
related to antecedent soil-moisture conditions and to<br />
the magnitude and intensity of rainfall. For example,<br />
time lag seems to have been longer after comparatively<br />
long periods of dry weather, and it seems to have been<br />
shorter for high-intensity storms and for storms of<br />
comparatively large magnitude. Presumably, soilmoisture<br />
deficiencies decrease the apparent rate of<br />
downward movement, and the higher hydraulic head<br />
in the partly filled basin during larger storms or during<br />
storms of high intensity increases the downward<br />
rate of movement.<br />
On the average, the time lag also seems to have increased<br />
during the cold-weather months, perhaps because<br />
of the greater viscosity of the water .. For example,<br />
the average time lag for stor1ns during Noveinber<br />
through ~1arch was 12.7 hours, and the a:verage<br />
time lag for the warm-weather months, April through<br />
October, was slightly more than 7 hours.<br />
The computed average rate of apparent downward<br />
movement through the zone of aeration is 5.0 feet per<br />
hour for the 38 storms. The average rate during the<br />
winter months is 3.0 feet per hour, and that during the<br />
summer months is 6.0 feet per hour.<br />
Even after intense storms or ones of long duration<br />
and associated large amounts of inflow to the basin,<br />
the basin floor commonly is dry within a few hours.<br />
This fact also suggests that the infiltration rate and<br />
the rate of movement in the zone of aeration are<br />
moderately high.<br />
Others (Isbister 1966, p. 49) have noted time lags of<br />
downward movement through the zone of aeration on<br />
Long Island ranging from less than 1 to more than 10<br />
months. The average time lag noted by Isbister, in an<br />
area where the depth to water is roughly comparable<br />
to that beneath the basin described in the present report,<br />
is 2-3 months. However, Isbister's observations<br />
were made in an area underlain by glacial till of low<br />
permeability, and the observations noted in this report<br />
are believed to be more nearly representative of conditions<br />
in areas underlain by the highly permeable<br />
glacial outwash.<br />
REFERENCES<br />
Isbister, John, 1966, Geology and hydrology of northeastern<br />
Nassau County, Long Island, N.Y.: U.S. Geol. Survey<br />
Water-Supply Paper 1825, 89 p.<br />
Seaburn, G. E., 1970, Preliminary results of hydrologic studies<br />
at two recharge basins on Long Island, N.Y.: U.S. Geol.<br />
Survey Prof. Paper 627-C, p.17.<br />
~


