

RESEARCH· ·1970·
RESEARCH· ·1970·
RESEARCH· ·1970·

You also want an ePaper? Increase the reach of your titles
YUMPU automatically turns print PDFs into web optimized ePapers that Google loves.
B82<br />
GEOPHYSICS<br />
J<br />
I<br />
37·~~------~~----L-~J-----~--------------L-~--------J_----~~-i-----L-------L--~--~--~<br />
B 0 10 20 30 40 Ml LES B '<br />
EXPLANATION<br />
~ --,soo---<br />
Magnetic contours<br />
Hachures indicate closed area of lower magnetic<br />
intenBit11; dashed where incomplete. Interval<br />
JOOgammas<br />
Flight lines<br />
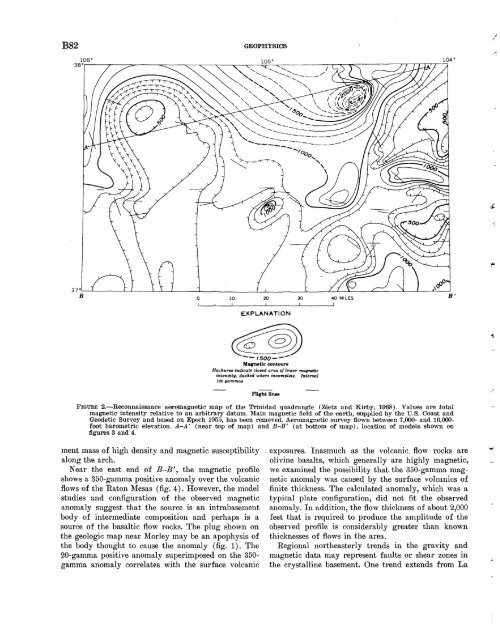
FIGURE 2.-Reconnaissanee aeromagnetic map of the Trinidad quadrangle (Zietz and Kirby, 1968). Values are .total<br />
magnetic intensity relative to an ar:bitrary datum. Main magnetic field of the ~earth, supplied by the U.S. Coast and<br />
Geodetic Survey and based on E'poch 1955, has been removed. Aeromagnetic survey flown between 7,000- and 16,000-<br />
foot barometric elevation. A-A' (near top of map) and B-B' (at botJtom of map), location of models shown on<br />
figures 3 and 4.<br />
ment mass of high density and magnetic susceptibility<br />
along the arch. ·<br />
Near the east end of B-B', the magnetic profile<br />
shows a 350-gamma positive anomaly over the volcanic<br />
flows of the Raton l\1esas (fig. 4). However, the model<br />
studies and configuration of the observed Inagnetic<br />
anomaly suggest that the source is an intrabasement<br />
body of intermediate composition and perhaps is a<br />
source of the basaltic flow rocks. The plug shown on<br />
the geologic map near l\1orley may be an apophysis of<br />
the body thought to cause the anomaly (fig. 1). The<br />
20-gamma positive anomaly superimposed on the 350-<br />
gamma anomaly correlates with the surface volcanic<br />
exposures. Inasmuch as the volcanic. flow rocks are<br />
olivine basalts, which generally are highly Inagnetic,<br />
we examined the possibility that the 350-gamma magnetic<br />
anomaly was caused by the surface volcanics of<br />
finite thickness. The calculated anomaly, which was a<br />
typical plate configuration, did not fit the observed<br />
anomaly. In addition, the flow thickness of about 2,000<br />
feet that is required to produce the a1nplitude of the<br />
observed profile is considerably greater than known<br />
thicknesses of flows in the area.<br />
Regional northeasterly trends in the gravity and<br />
magnetic data may represent faults or shear zones in<br />
the crystalline basement. One trend extends from La


