

RESEARCH· ·1970·
RESEARCH· ·1970·
RESEARCH· ·1970·

You also want an ePaper? Increase the reach of your titles
YUMPU automatically turns print PDFs into web optimized ePapers that Google loves.
BENNETT AND McQUIVEY<br />
turbulence in open-channel flow, the bulk of the energy<br />
occurs at much lower :frequencies (below 10Hz) than it<br />
does in air. For this reason, the power spectral densities<br />
of this study were obtained by digital-cmnputer methods,<br />
wherein the low-frequency resolution is limited<br />
only by t,he length of record which can be processed.<br />
.Data processing by digital methods could not be accomplished<br />
in the field, so the output voltages from the<br />
1nensuring systems were recorded on n~agnctic tape for<br />
later n .. nalysis. The output :from the hot-fihn anemometer<br />
was recorded directly; that from the propeller flowmeter<br />
1neasuring syst01n had to be amplified before it<br />
could be recorded. '"!"he a-c amplifier used had n. lowfrequency<br />
cutoff of 1 II~.<br />
In addition to measurements of power specti·al<br />
density, several measurements were made in which only<br />
longitudinal turbulence intensities, 1~', were obtained.<br />
The voltage intensity for substitution into equa.tion 6<br />
was obtn .. ined frotn an analog root-mean-square (rms)<br />
voltage meter or, when a..va,ilable, from the output of the<br />
computation program :for power spectral density. The<br />
analog rms meter had a low-frequency cutoff of 0.5 l-Iz,<br />
and 11 high-frequency-response flat well beyond the<br />
ra.nge of frequencies o:f interest. The 0.5-Ilz cutoff prevents<br />
the rms 1neter from n1ensur.ing all the turbulence<br />
energy eontained in the velocity fluctuations having frequencies<br />
o:f less than 0.5 l-Iz.<br />
Because the output of the hot-f-ilm anemometer could<br />
be corrected for drift, and because the hot-film anemometer<br />
:is free of inertial and spatial averaging problems,<br />
the results of :the hot-iihn measurements have been used<br />
as stanclnrcls for judging the perfonnance of the propeller<br />
flown1eter.<br />
MEASUREMENT OF POWER SPECTRAL DENSITY<br />
B259<br />
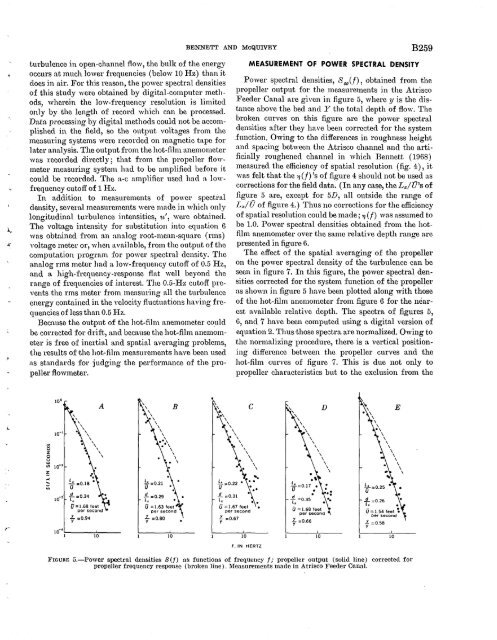
Power spectral densities, S 00<br />
(.f), obtained from the<br />
propeller output for the measurements in the Atrisco<br />
Feeder Canal are given in figure 5, where y is the distanee<br />
above the bed and } 7 the total depth of flow. The<br />
broken curves on this figure a.re the power spectral<br />
densities after they have been corrected for the system<br />
.function. Owing to the differences in roughness height<br />
a .. nd spaeing between the Atrisco channel and the artificially<br />
roughened ehannel in which Bennett (1968)<br />
1neasured the efficiency of spatial resolution (fig. 4), it<br />
was felt that the '1 (f)'s of figure 4 should not be used as<br />
corrections for the field da;ta. (In any ca.se, the Lx/U's of<br />
figu:_e 5 are, except for 5D, all outside the range of<br />
La:!U of figure 4.) Thus no corrections for the efficiency<br />
of spatial resolution could be 1nade; '1 (f) was assumed to<br />
be 1.0. Power spectral densities obtained frmn the hotfilm<br />
anemon1eter over the same relative d~pth range are<br />
presented in figure 6.<br />
The effect of the spatial averaging of the propeller<br />
on the power spectral density of tlie turbulence ·can be<br />
seen in figure 7. In this figure, the power spectral densities<br />
corrected for the system function of the propel~er<br />
as shown in figure 5 have been plotted along with those<br />
of the hot-film anemometer frmn figure 6 for the nearest<br />
available relative depth. The spectra of figures 5,<br />
6, and 7 have been computed using a digital version of<br />
equation 2. Thus those spectra are normalized. Owing to<br />
the normalizing procedure, there is a vertical positioning<br />
difference between the propeller curves and the<br />
hot-film eurves of figure 7. This is due not only to<br />
propeller characteristics but to the exclusion from the<br />
Ill<br />
0<br />
z<br />
0<br />
u<br />
100<br />
10-1<br />
U.J<br />
Ill 10- 2<br />
~<br />
.....<br />
...<br />
VI<br />
A<br />
10- 3 1:-:0.34 ·-~<br />
iJ = 1.68 feet<br />
per second<br />
f :0.94<br />
\ B<br />
' ' .,<br />
' '<br />
\<br />
..' \ \<br />
.. \<br />
~=0.21<br />
u<br />
\<br />
.<br />
\<br />
\<br />
\<br />
10-·<br />
1 10 10<br />
.!:..!.::0.22 •<br />
iJ<br />
c<br />
.!!._ :::0.31<br />
L~<br />
a ==1.67 feet<br />
per second<br />
f :0.67<br />
10<br />
f,IN HERTZ<br />
.<br />
d •<br />
T,. =0.35<br />
D<br />
iJ =1.68 feet<br />
per second<br />
f :::0.66<br />
E<br />
\<br />
\<br />
\<br />
., \<br />
\<br />
\<br />
\<br />
\<br />
\<br />
\<br />
10 10<br />
\<br />
\<br />
\<br />
\<br />
l!'roum~ 5.-Power spectral densities S(f) as functions of frequency t~· propeller output (solid line) corrected for<br />
propeller frequency response (broken line). Measurements made in Atrisco Feeder Canal.


