

RESEARCH· ·1970·
RESEARCH· ·1970·
RESEARCH· ·1970·

Create successful ePaper yourself
Turn your PDF publications into a flip-book with our unique Google optimized e-Paper software.
B258<br />
HYDROLOGIC TECHNIQUES<br />
1.0<br />
~<br />
Qj<br />
c.<br />
• e<br />
0..<br />
18, 2-3, 0.22<br />
12, 1-3, 0.45<br />
12, 1, 0.74<br />
[] :2.0 feet per second<br />
18, 1-3. 0.23<br />
I:' 0.1 ~<br />
Run No.<br />
u<br />
12 0.17<br />
16 0.13<br />
17 0.11<br />
18 0.17<br />
18, 1, 0.37<br />
16. 2-3, 0.22<br />
16, 1-3. 0.20<br />
17. 2-3, 0.36<br />
17. 1-3, 0.36<br />
[] = 3.2 feet per second<br />
16. 1, 0.33<br />
17. 1, 0.43<br />
0.01 ~1 ----'-------'------'---..___1_._0 ____ ..~--___ ~-----....J<br />
f, IN HERTZ<br />
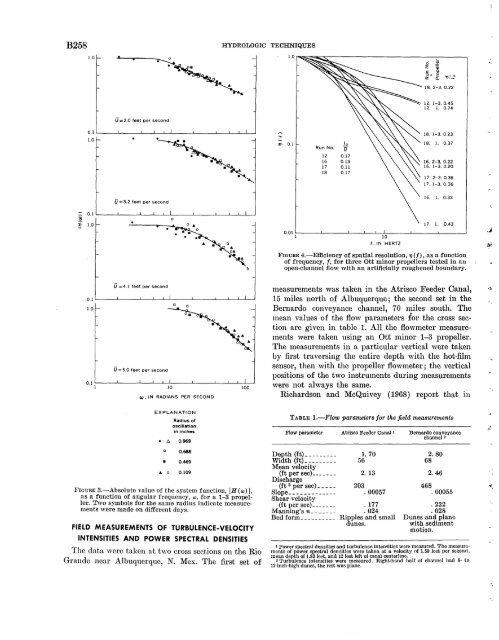
FIGURE 4.-Efficiency of spatial resolution, 71 (f), as a function<br />
of frequency, f, for three Ott minor propellers tested in an<br />
open-channel flow with an artificially roughened boundary.<br />
iJ = 4.1 feet per second<br />
0.1~--~L---~---L~~----~----~---L~~~<br />
1.0<br />
V = 5.0 feet per second<br />
W, IN RADIANS PER SECOND<br />
n1easuren1ents was taken in the Atrisco Feeder Canal,<br />
15 miles north of Albuquerque; the second set in the<br />
Bernardo conveyance channel, 70 1niles· south. The<br />
mean values of the flow parmneters lor the cross section<br />
are given in table 1. All the flowmeter Ineasurements<br />
were taken using an Ott minor 1-3 propeller.<br />
The 1neasurements in a particular vertical were taken<br />
by first traversing the entire depth with the hot-fihn<br />
sensor, then with the propeller flown1eter; the vertical<br />
positions of the two instrmnents during 1neasurements<br />
were not always the same.<br />
Richardson and McQuivey (1968) report that 111<br />
·,,<br />
EXPLANATION<br />
Radius of<br />
oscillation,<br />
in inches<br />
• 6 0.969<br />
c 0.688<br />
• 0.469<br />
• 0 0.109<br />
FrauRE 3.-Absolute value of the system function, jH(w) j,<br />
as a function of angular frequency, w, for a 1-3 propeller.<br />
Two symbols for the same radius indicate measurements<br />
were .made on different days.<br />
FI.ELD MEASUREMENTS OF TUR'BULENCE-VELOCITY<br />
INTENSITIES AND POWER SPECTRAL DENSITIES<br />
The clatn. were taken at byo cross sections on the Rio<br />
Grande ncar Albuquerque, N. ~1cx. The first set of<br />
TABLE 1.-Flow parameters for the field measurements<br />
Flow parameter<br />
Depth (ft) ________ _<br />
Width (ft) ___ -·- ___ _<br />
Mean velocity<br />
(ft per sec) ______ _<br />
Discharge<br />
(ft a per sec) ____ _<br />
Slope __ - __ - ------<br />
Shear velocity<br />
.(ft per sec) ______ _<br />
Manning's n ______ _<br />
Bed form _________ _<br />
Atrisco Feeder Canal 1<br />
1. 70<br />
56<br />
2. 13<br />
203<br />
. 00057<br />
. 177<br />
. 024<br />
Ripples and small<br />
dunes.<br />
Bernardo conveyance<br />
cbannel2<br />
2. 80<br />
68<br />
2.46<br />
468<br />
. 00055<br />
. 222<br />
. 028<br />
Dunes and plane<br />
with sediment<br />
motion.<br />
1 Power spectral densities and turbulence intensities were measured. The measurements<br />
of power spectral densities were taken at a velocity or 1.59 feet per second,<br />
mean depth of 1.83 feet, and 12 feet left of canal centerline.<br />
2 Turbulence intensities were measured. Right-hand half of channel had 8- to<br />
12-inch-high dunes, the rest was plane.


