

Films minces à base de Si nanostructuré pour des cellules ...
Films minces à base de Si nanostructuré pour des cellules ...
Films minces à base de Si nanostructuré pour des cellules ...

You also want an ePaper? Increase the reach of your titles
YUMPU automatically turns print PDFs into web optimized ePapers that Google loves.
<strong>Si</strong>-np and their agglomeration. For this purpose, a ML composed of 50 patterns of 3<br />
nm SRSO-P15 and 3 nm-<strong>Si</strong>O 2 was grown. All the MLs in the following discussions<br />
will be represented as 'Pattern number (t SRSOnm /t <strong>Si</strong>O2 nm)'. Prior to the study on<br />
emission behaviours, the structure of our 50(3/3) ML is investigated to ensure the<br />
sublayer thicknesses are as expected to form <strong>Si</strong>-np. Most of the studies unless specied<br />
otherwise are done on the as-grown samples and the samples annealed at two<br />
chosen annealing treatments : 1min-1000°C and 1h-1100°C. These two annealing<br />
treatments are interesting since we assume that:<br />
ˆ a Short Time Annealing (STA) at 1min-1000°C allows the completion of <strong>Si</strong><br />
seeds which grow with further annealing treatments and crystallize.<br />
tel-00916300, version 1 - 10 Dec 2013<br />
ˆ the Classical Annealing (CA) at 1h-1100°C almost completes the formation of<br />
<strong>Si</strong>-np.<br />
The intermediate annealing temperatures are analyzed if there is a need.<br />
3.7.1 Structural analysis<br />
(a) Fourier transform infrared spectroscopy and X-Ray Diraction<br />
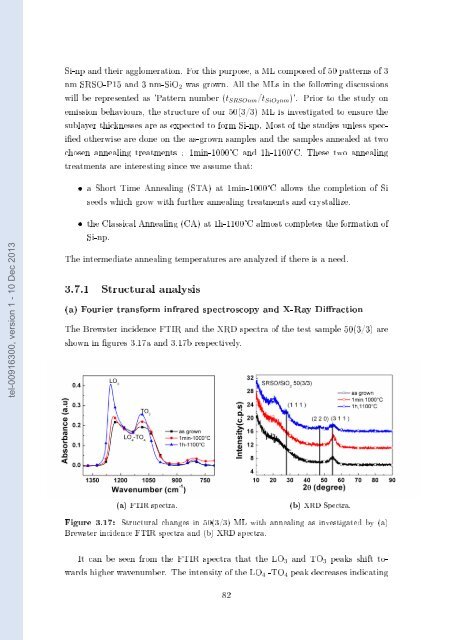
The Brewster inci<strong>de</strong>nce FTIR and the XRD spectra of the test sample 50(3/3) are<br />
shown in gures 3.17a and 3.17b respectively.<br />
(a) FTIR spectra.<br />
(b) XRD Spectra.<br />
Figure 3.17: Structural changes in 50(3/3) ML with annealing as investigated by (a)<br />
Brewster inci<strong>de</strong>nce FTIR spectra and (b) XRD spectra.<br />
It can be seen from the FTIR spectra that the LO 3 and TO 3 peaks shift towards<br />
higher wavenumber. The intensity of the LO 4 -TO 4 peak <strong>de</strong>creases indicating<br />
82


