

Films minces à base de Si nanostructuré pour des cellules ...
Films minces à base de Si nanostructuré pour des cellules ...
Films minces à base de Si nanostructuré pour des cellules ...

Create successful ePaper yourself
Turn your PDF publications into a flip-book with our unique Google optimized e-Paper software.
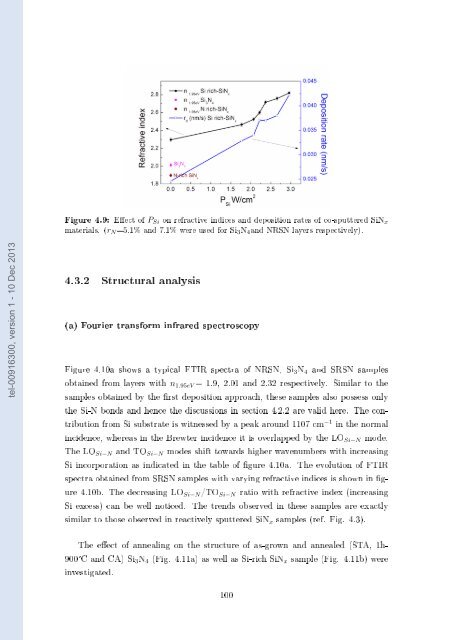
Figure 4.9: Eect of P <strong>Si</strong> on refractive indices and <strong>de</strong>position rates of co-sputtered <strong>Si</strong>N x<br />
materials. (r N =5.1% and 7.1% were used for <strong>Si</strong> 3 N 4 and NRSN layers respectively).<br />
tel-00916300, version 1 - 10 Dec 2013<br />
4.3.2 Structural analysis<br />
(a) Fourier transform infrared spectroscopy<br />
Figure 4.10a shows a typical FTIR spectra of NRSN, <strong>Si</strong> 3 N 4 and SRSN samples<br />
obtained from layers with n 1.95eV = 1.9, 2.01 and 2.32 respectively. <strong>Si</strong>milar to the<br />
samples obtained by the rst <strong>de</strong>position approach, these samples also possess only<br />
the <strong>Si</strong>-N bonds and hence the discussions in section 4.2.2 are valid here. The contribution<br />
from <strong>Si</strong> substrate is witnessed by a peak around 1107 cm −1 in the normal<br />
inci<strong>de</strong>nce, whereas in the Brewter inci<strong>de</strong>nce it is overlapped by the LO <strong>Si</strong>−N mo<strong>de</strong>.<br />
The LO <strong>Si</strong>−N and TO <strong>Si</strong>−N mo<strong>de</strong>s shift towards higher wavenumbers with increasing<br />
<strong>Si</strong> incorporation as indicated in the table of gure 4.10a. The evolution of FTIR<br />
spectra obtained from SRSN samples with varying refractive indices is shown in gure<br />
4.10b. The <strong>de</strong>creasing LO <strong>Si</strong>−N /TO <strong>Si</strong>−N ratio with refractive in<strong>de</strong>x (increasing<br />
<strong>Si</strong> excess) can be well noticed. The trends observed in these samples are exactly<br />
similar to those observed in reactively sputtered <strong>Si</strong>N x samples (ref. Fig. 4.3).<br />
The eect of annealing on the structure of as-grown and annealed (STA, 1h-<br />
900°C and CA) <strong>Si</strong> 3 N 4 (Fig. 4.11a) as well as <strong>Si</strong>-rich <strong>Si</strong>N x sample (Fig. 4.11b) were<br />
investigated.<br />
100


