

Films minces à base de Si nanostructuré pour des cellules ...
Films minces à base de Si nanostructuré pour des cellules ...
Films minces à base de Si nanostructuré pour des cellules ...

You also want an ePaper? Increase the reach of your titles
YUMPU automatically turns print PDFs into web optimized ePapers that Google loves.
The LO 3 and TO 3 peaks approach each other, resulting in the increasing intensity<br />
of LO 4 -TO 4 doublet. This is an indication that the increasing <strong>Si</strong> excess induces<br />
disor<strong>de</strong>r in the <strong>de</strong>posited layer. <strong>Si</strong>nce the peak around 1107 cm −1 appears from<br />
P <strong>Si</strong> = 2.07 W/cm 2 onwards and increases gradually with increasing power applied<br />
on <strong>Si</strong> catho<strong>de</strong>, we can conrm that this peak is associated with <strong>Si</strong> excess. This peak<br />
thus can be attributed to be a combined contribution of increasing disor<strong>de</strong>r in the<br />
matrix and agglomeration of <strong>Si</strong> with interstitial oxygen.<br />
(c) <strong>Si</strong> excess estimation<br />
tel-00916300, version 1 - 10 Dec 2013<br />
P <strong>Si</strong> (W/cm 2 ) ν T O3 x = 0/<strong>Si</strong><br />
from<br />
FTIR<br />
<strong>Si</strong> excess<br />
(at.%) from<br />
FTIR<br />
(unbon<strong>de</strong>d<br />
<strong>Si</strong>)<br />
x = 0/<strong>Si</strong><br />
from ellipsometry<br />
<strong>Si</strong> excess<br />
(at.%)<br />
from<br />
ellipsometry<br />
(agglomerated<br />
<strong>Si</strong>)<br />
1.62 1046 1.62 7.25 1.75 5.4<br />
1.77 1045 1.61 7.47 1.68 6.7<br />
2.07 1042 1.57 8.2 1.64 7.6<br />
2.22 1042 1.57 8.2 1.57 9.2<br />
2.37 1041 1.56 8.45 1.57 9.2<br />
2.66 1040 1.55 8.8 1.50 10.8<br />
2.96 1039 1.54 8.96 1.43 12.57<br />
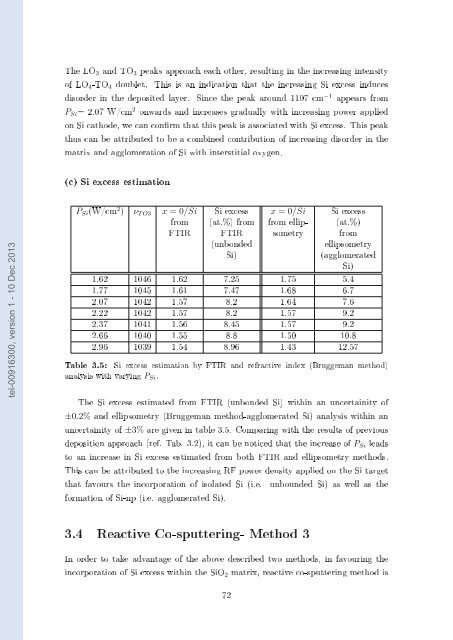
Table 3.5: <strong>Si</strong> excess estimation by FTIR and refractive in<strong>de</strong>x (Bruggeman method)<br />
analysis with varying P <strong>Si</strong> .<br />
The <strong>Si</strong> excess estimated from FTIR (unbon<strong>de</strong>d <strong>Si</strong>) within an uncertainity of<br />
±0.2% and ellipsometry (Bruggeman method-agglomerated <strong>Si</strong>) analysis within an<br />
uncertainity of ±3% are given in table 3.5. Comparing with the results of previous<br />
<strong>de</strong>position approach (ref. Tab. 3.2), it can be noticed that the increase of P <strong>Si</strong> leads<br />
to an increase in <strong>Si</strong> excess estimated from both FTIR and ellipsometry methods.<br />
This can be attributed to the increasing RF power <strong>de</strong>nsity applied on the <strong>Si</strong> target<br />
that favours the incorporation of isolated <strong>Si</strong> (i.e. unboun<strong>de</strong>d <strong>Si</strong>) as well as the<br />
formation of <strong>Si</strong>-np (i.e. agglomerated <strong>Si</strong>).<br />
3.4 Reactive Co-sputtering- Method 3<br />
In or<strong>de</strong>r to take advantage of the above <strong>de</strong>scribed two methods, in favouring the<br />
incorporation of <strong>Si</strong> excess within the <strong>Si</strong>O 2 matrix, reactive co-sputtering method is<br />
72


