

Films minces à base de Si nanostructuré pour des cellules ...
Films minces à base de Si nanostructuré pour des cellules ...
Films minces à base de Si nanostructuré pour des cellules ...

You also want an ePaper? Increase the reach of your titles
YUMPU automatically turns print PDFs into web optimized ePapers that Google loves.
<strong>Si</strong>-np. This phase separation process into <strong>Si</strong> agglomerates and <strong>Si</strong>O 2 is witnessed<br />
from v T O3 and <strong>de</strong>creased intensity of LO 4 −TO 4 peak in the FTIR spectra. This<br />
also explains the <strong>de</strong>crease of <strong>Si</strong> excess estimated by FTIR method in table 3.2.<br />
We may also assume that with increasing T d there is an increase in size of the<br />
<strong>Si</strong> agglomerates favoured by higher <strong>Si</strong> content and longer diusion time. This could<br />
explain the progressive <strong>de</strong>crease in the LO 3 peak intensity which reects the <strong>Si</strong>-<strong>Si</strong>O 2<br />
interfaces since with increasing sizes, the number of the agglomerates and therefore<br />
the number of interfaces may <strong>de</strong>crease.<br />
<strong>Si</strong>nce the <strong>de</strong>crease in LO 3 peak intensity indicates a lower total interface area at<br />
higher T d and consequently a lower number of <strong>Si</strong>-agglomerates, we may write the<br />
following equation,<br />
tel-00916300, version 1 - 10 Dec 2013<br />
N h S h < N l S l ⇒ N h (4πR h 2 ) < N l (4πR l 2 ) Eqn (3.10)<br />
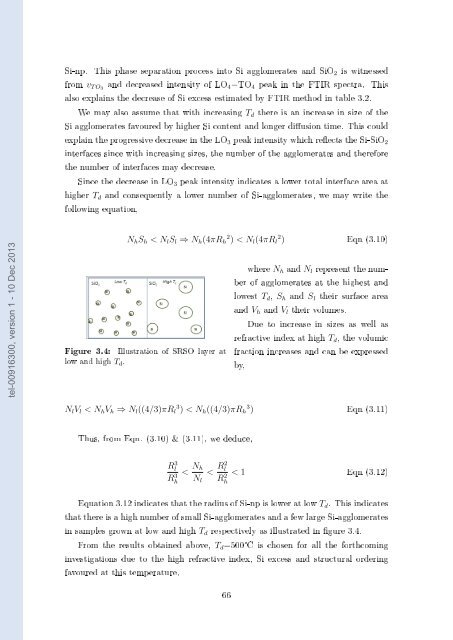
Figure 3.4: Illustration of SRSO layer at<br />
low and high T d .<br />
where N h and N l represent the number<br />
of agglomerates at the highest and<br />
lowest T d , S h and S l their surface area<br />
and V h and V l their volumes.<br />
Due to increase in sizes as well as<br />
refractive in<strong>de</strong>x at high T d , the volumic<br />
fraction increases and can be expressed<br />
by,<br />
N l V l < N h V h ⇒ N l ((4/3)πR l 3 ) < N h ((4/3)πR h 3 ) Eqn (3.11)<br />
Thus, from Eqn. (3.10) & (3.11), we <strong>de</strong>duce,<br />
Rl<br />
3<br />
Rh<br />
3<br />
< N h<br />
N l<br />
< R2 l<br />
R 2 h<br />
< 1 Eqn (3.12)<br />
Equation 3.12 indicates that the radius of <strong>Si</strong>-np is lower at low T d . This indicates<br />
that there is a high number of small <strong>Si</strong>-agglomerates and a few large <strong>Si</strong>-agglomerates<br />
in samples grown at low and high T d respectively as illustrated in gure 3.4.<br />
From the results obtained above, T d =500°C is chosen for all the forthcoming<br />
investigations due to the high refractive in<strong>de</strong>x, <strong>Si</strong> excess and structural or<strong>de</strong>ring<br />
favoured at this temperature.<br />
66


