

Films minces à base de Si nanostructuré pour des cellules ...
Films minces à base de Si nanostructuré pour des cellules ...
Films minces à base de Si nanostructuré pour des cellules ...

You also want an ePaper? Increase the reach of your titles
YUMPU automatically turns print PDFs into web optimized ePapers that Google loves.
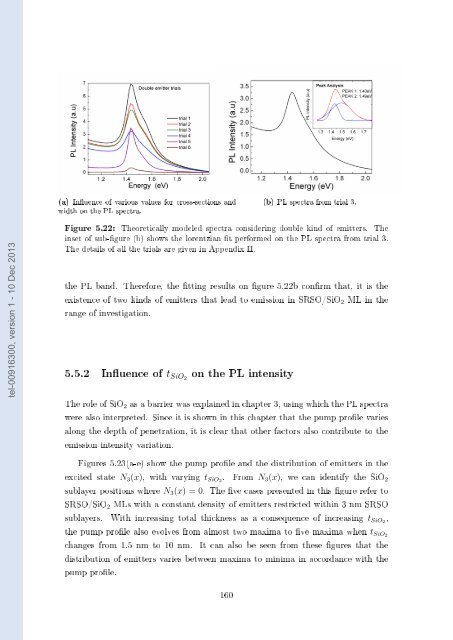
(a) Inuence of various values for cross-sections and<br />
width on the PL spectra.<br />
(b) PL spectra from trial 3.<br />
tel-00916300, version 1 - 10 Dec 2013<br />
Figure 5.22: Theoretically mo<strong>de</strong>led spectra consi<strong>de</strong>ring double kind of emitters. The<br />
inset of sub-gure (b) shows the lorentzian t performed on the PL spectra from trial 3.<br />
The <strong>de</strong>tails of all the trials are given in Appendix II.<br />
the PL band. Therefore, the tting results on gure 5.22b conrm that, it is the<br />
existence of two kinds of emitters that lead to emission in SRSO/<strong>Si</strong>O 2 ML in the<br />
range of investigation.<br />
5.5.2 Inuence of t <strong>Si</strong>O2 on the PL intensity<br />
The role of <strong>Si</strong>O 2 as a barrier was explained in chapter 3, using which the PL spectra<br />
were also interpreted. <strong>Si</strong>nce it is shown in this chapter that the pump prole varies<br />
along the <strong>de</strong>pth of penetration, it is clear that other factors also contribute to the<br />
emission intensity variation.<br />
Figures 5.23(a-e) show the pump prole and the distribution of emitters in the<br />
excited state N 3 (x), with varying t <strong>Si</strong>O2 . From N 3 (x), we can i<strong>de</strong>ntify the <strong>Si</strong>O 2<br />
sublayer positions where N 3 (x) = 0. The ve cases presented in this gure refer to<br />
SRSO/<strong>Si</strong>O 2 MLs with a constant <strong>de</strong>nsity of emitters restricted within 3 nm SRSO<br />
sublayers. With increasing total thickness as a consequence of increasing t <strong>Si</strong>O2 ,<br />
the pump prole also evolves from almost two maxima to ve maxima when t <strong>Si</strong>O2<br />
changes from 1.5 nm to 10 nm. It can also be seen from these gures that the<br />
distribution of emitters varies between maxima to minima in accordance with the<br />
pump prole.<br />
160


