

Films minces à base de Si nanostructuré pour des cellules ...
Films minces à base de Si nanostructuré pour des cellules ...
Films minces à base de Si nanostructuré pour des cellules ...

You also want an ePaper? Increase the reach of your titles
YUMPU automatically turns print PDFs into web optimized ePapers that Google loves.
the host <strong>Si</strong>O 2 matrix leading to an increase in n 1.95eV . This method is thus advantageous<br />
than method 1 since by controlling the ratio of power <strong>de</strong>nsities between <strong>Si</strong><br />
and <strong>Si</strong>O 2 it is possible to incorporate higher <strong>Si</strong> excess at a higher r d .<br />
3.3.2 Fourier transorm infrared spectroscopy<br />
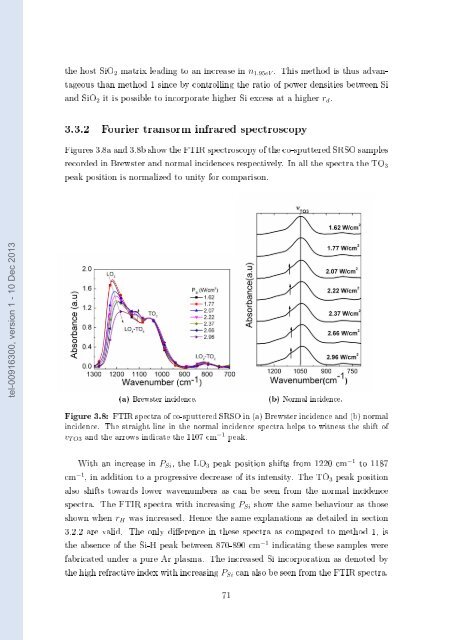
Figures 3.8a and 3.8b show the FTIR spectroscopy of the co-sputtered SRSO samples<br />
recor<strong>de</strong>d in Brewster and normal inci<strong>de</strong>nces respectively. In all the spectra the TO 3<br />
peak position is normalized to unity for comparison.<br />
tel-00916300, version 1 - 10 Dec 2013<br />
(a) Brewster inci<strong>de</strong>nce.<br />
(b) Normal inci<strong>de</strong>nce.<br />
Figure 3.8: FTIR spectra of co-sputtered SRSO in (a) Brewster inci<strong>de</strong>nce and (b) normal<br />
inci<strong>de</strong>nce. The straight line in the normal inci<strong>de</strong>nce spectra helps to witness the shift of<br />
v T O3 and the arrows indicate the 1107 cm −1 peak.<br />
With an increase in P <strong>Si</strong> , the LO 3 peak position shifts from 1220 cm −1 to 1187<br />
cm −1 , in addition to a progressive <strong>de</strong>crease of its intensity. The TO 3 peak position<br />
also shifts towards lower wavenumbers as can be seen from the normal inci<strong>de</strong>nce<br />
spectra. The FTIR spectra with increasing P <strong>Si</strong> show the same behaviour as those<br />
shown when r H was increased. Hence the same explanations as <strong>de</strong>tailed in section<br />
3.2.2 are valid. The only dierence in these spectra as compared to method 1, is<br />
the absence of the <strong>Si</strong>-H peak between 870-890 cm −1 indicating these samples were<br />
fabricated un<strong>de</strong>r a pure Ar plasma. The increased <strong>Si</strong> incorporation as <strong>de</strong>noted by<br />
the high refractive in<strong>de</strong>x with increasing P <strong>Si</strong> can also be seen from the FTIR spectra.<br />
71


