

Films minces à base de Si nanostructuré pour des cellules ...
Films minces à base de Si nanostructuré pour des cellules ...
Films minces à base de Si nanostructuré pour des cellules ...

Create successful ePaper yourself
Turn your PDF publications into a flip-book with our unique Google optimized e-Paper software.
and the intensity is gradually <strong>de</strong>creased for all other t A . It has to be noticed that<br />
for annealing time longer than 1min, the three peak structure disappears. As in<br />
the previous case, the shift of the peak (2) with respect to the as-grown sample can<br />
be ascribed to the growth of <strong>Si</strong>-np. The observed <strong>de</strong>crease of PL intensity for time<br />
higher than 1min can be explained in the same way as that in the case of 700 °C.<br />
4.6.4 T A =1000°C:<br />
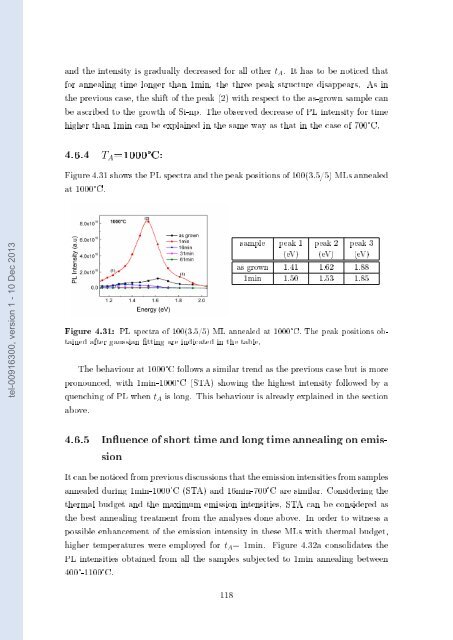
Figure 4.31 shows the PL spectra and the peak positions of 100(3.5/5) MLs annealed<br />
at 1000°C.<br />
tel-00916300, version 1 - 10 Dec 2013<br />
sample peak 1<br />
(eV)<br />
peak 2<br />
(eV)<br />
peak 3<br />
(eV)<br />
as grown 1.41 1.62 1.88<br />
1min 1.50 1.53 1.85<br />
Figure 4.31: PL spectra of 100(3.5/5) ML annealed at 1000°C. The peak positions obtained<br />
after gaussian tting are indicated in the table.<br />
The behaviour at 1000°C follows a similar trend as the previous case but is more<br />
pronounced, with 1min-1000°C (STA) showing the highest intensity followed by a<br />
quenching of PL when t A is long. This behaviour is already explained in the section<br />
above.<br />
4.6.5 Inuence of short time and long time annealing on emission<br />
It can be noticed from previous discussions that the emission intensities from samples<br />
annealed during 1min-1000°C (STA) and 16min-700°C are similar. Consi<strong>de</strong>ring the<br />
thermal budget and the maximum emission intensities, STA can be consi<strong>de</strong>red as<br />
the best annealing treatment from the analyses done above. In or<strong>de</strong>r to witness a<br />
possible enhancement of the emission intensity in these MLs with thermal budget,<br />
higher temperatures were employed for t A = 1min. Figure 4.32a consolidates the<br />
PL intensities obtained from all the samples subjected to 1min annealing between<br />
400°-1100°C.<br />
118


