

Films minces à base de Si nanostructuré pour des cellules ...
Films minces à base de Si nanostructuré pour des cellules ...
Films minces à base de Si nanostructuré pour des cellules ...

You also want an ePaper? Increase the reach of your titles
YUMPU automatically turns print PDFs into web optimized ePapers that Google loves.
tel-00916300, version 1 - 10 Dec 2013<br />
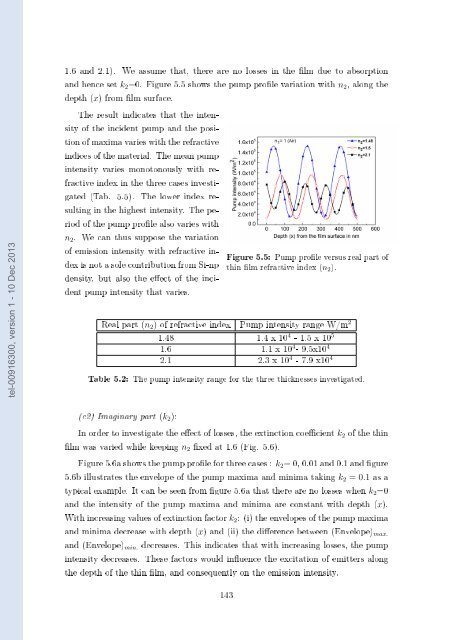
1.6 and 2.1). We assume that, there are no losses in the lm due to absorption<br />
and hence set k 2 =0. Figure 5.5 shows the pump prole variation with n 2 , along the<br />
<strong>de</strong>pth (x) from lm surface.<br />
The result indicates that the intensity<br />
of the inci<strong>de</strong>nt pump and the position<br />
of maxima varies with the refractive<br />
indices of the material. The mean pump<br />
intensity varies monotonously with refractive<br />
in<strong>de</strong>x in the three cases investigated<br />
(Tab. 5.5). The lower in<strong>de</strong>x resulting<br />
in the highest intensity. The period<br />
of the pump prole also varies with<br />
n 2 . We can thus suppose the variation<br />
of emission intensity with refractive in<strong>de</strong>x<br />
is not a sole contribution from <strong>Si</strong>-np<br />
<strong>de</strong>nsity, but also the eect of the inci<strong>de</strong>nt<br />
pump intensity that varies.<br />
Figure 5.5: Pump prole versus real part of<br />
thin lm refractive in<strong>de</strong>x (n 2 ).<br />
Real part (n 2 ) of refractive in<strong>de</strong>x Pump intensity range W/m 2<br />
1.48 1.4 x 10 4 - 1.5 x 10 5<br />
1.6 1.1 x 10 4 - 9.5x10 4<br />
2.1 2.3 x 10 4 - 7.9 x10 4<br />
Table 5.2: The pump intensity range for the three thicknesses investigated.<br />
(c2) Imaginary part (k 2 ):<br />
In or<strong>de</strong>r to investigate the eect of losses, the extinction coecient k 2 of the thin<br />
lm was varied while keeping n 2 xed at 1.6 (Fig. 5.6).<br />
Figure 5.6a shows the pump prole for three cases : k 2 = 0, 0.01 and 0.1 and gure<br />
5.6b illustrates the envelope of the pump maxima and minima taking k 2 = 0.1 as a<br />
typical example. It can be seen from gure 5.6a that there are no losses when k 2 =0<br />
and the intensity of the pump maxima and minima are constant with <strong>de</strong>pth (x).<br />
With increasing values of extinction factor k 2 : (i) the envelopes of the pump maxima<br />
and minima <strong>de</strong>crease with <strong>de</strong>pth (x) and (ii) the dierence between (Envelope) max.<br />
and (Envelope) min. <strong>de</strong>creases. This indicates that with increasing losses, the pump<br />
intensity <strong>de</strong>creases. These factors would inuence the excitation of emitters along<br />
the <strong>de</strong>pth of the thin lm, and consequently on the emission intensity.<br />
143


