

Download Volume II Accomplisments (28 Mb pdf). - IRIS
Download Volume II Accomplisments (28 Mb pdf). - IRIS
Download Volume II Accomplisments (28 Mb pdf). - IRIS

You also want an ePaper? Increase the reach of your titles
YUMPU automatically turns print PDFs into web optimized ePapers that Google loves.
Infrasonic Imaging with the USArray<br />
Kris Walker (Laboratory for Atmospheric Acoustics, IGPP, SIO, Univ. of California, San Diego), Michael Hedlin (Laboratory<br />
for Atmospheric Acoustics, IGPP, SIO, Univ. of California, San Diego), Catherine de Groot-Hedlin (Laboratory for<br />
Atmospheric Acoustics, IGPP, SIO, Univ. of California, San Diego)<br />
The USArray directly measures ground motion, which can mostly be attributed to ocean waves, earthquakes, volcanoes, and<br />
weather systems that load the Earth’s surface. Another source of ground motion is the transfer of atmospheric acoustic energy<br />
into seismic energy at the Earth’s surface. Infrasound (low frequency sound below ~20 Hz) can travel great distances unattenuated<br />
in atmospheric ducts created by layers of slow sound speed. The infrasound wave field is rich due to a variety of anthropogenic<br />
and geophysical phenomena including earthquakes, volcanoes, landslides, meteors, lightning and sprites, auroras, and<br />
oceanic and atmospheric processes. Globally spaced microbarometer arrays with apertures of 100 m to 2 km are typically used<br />
to study these sources. However, these arrays are separated by thousands of kilometers, which places considerable limits on what<br />
they can teach us about infrasound source physics. The USArray is in a position to study infrasound sources in unprecedented<br />
detail. Array processing methods, such as reverse-time migration (RTM), may work well in automated detection and location<br />
of infrasound sources registered by the USArray (see also Hedlin et al. contribution). Hundreds of sources have been detected<br />
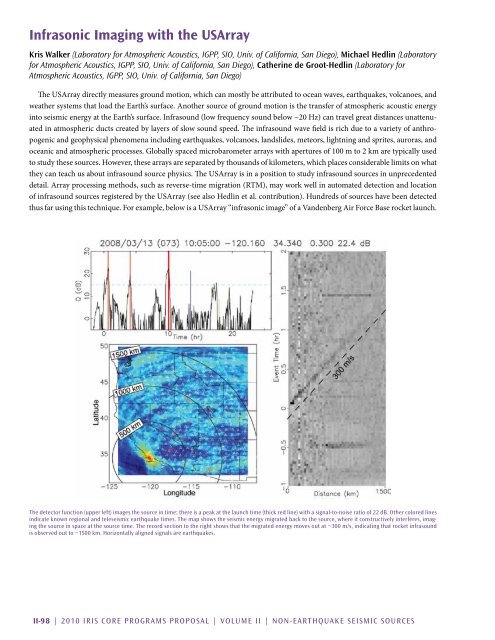
thus far using this technique. For example, below is a USArray “infrasonic image” of a Vandenberg Air Force Base rocket launch.<br />
The detector function (upper left) images the source in time; there is a peak at the launch time (thick red line) with a signal-to-noise ratio of 22 dB. Other colored lines<br />
indicate known regional and teleseismic earthquake times. The map shows the seismic energy migrated back to the source, where it constructively interferes, imaging<br />
the source in space at the source time. The record section to the right shows that the migrated energy moves out at ~300 m/s, indicating that rocket infrasound<br />
is observed out to ~1500 km. Horizontally aligned signals are earthquakes.<br />
<strong>II</strong>-98 | 2010 <strong>IRIS</strong> Core Programs Proposal | <strong>Volume</strong> <strong>II</strong> | Non-earthquake Seismic Sources


