

Download Volume II Accomplisments (28 Mb pdf). - IRIS
Download Volume II Accomplisments (28 Mb pdf). - IRIS
Download Volume II Accomplisments (28 Mb pdf). - IRIS

You also want an ePaper? Increase the reach of your titles
YUMPU automatically turns print PDFs into web optimized ePapers that Google loves.
3-D Isotropic Shear Velocity Model from Ambient Noise and<br />
Earthquake Tomography<br />
Weisen Shen (University of Colorado at Boulder), Yingjie Yang (University of Colorado at Boulder), Fan-Chi Lin<br />
(University of Colorado at Boulder), Michael H. Ritzwoller (University of Colorado at Boulder)<br />
Ambient Noise Tomography (ANT) is an efficient way to image the earth’s crust since its inception in 2005. We use over<br />
300,000 cross-correlations from ambient noise based on the past three years of EarthScope/USArray Transportable Array (TA)<br />
data. This data set provides empirical green’s functions between each pair of stations and finally results in over 100,000 high SNR<br />
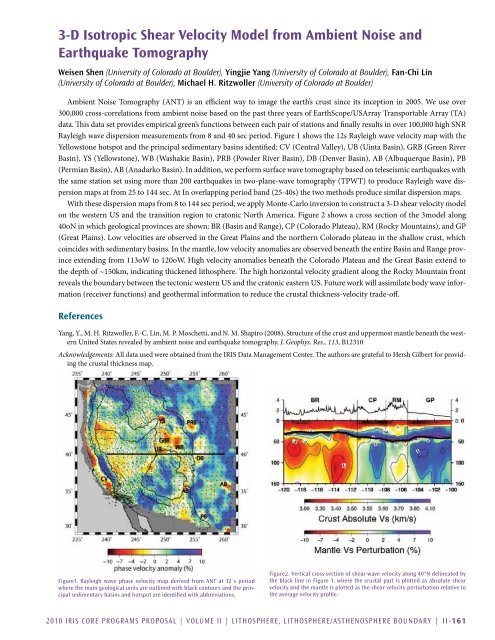
Rayleigh wave dispersion measurements from 8 and 40 sec period. Figure 1 shows the 12s Rayleigh wave velocity map with the<br />
Yellowstone hotspot and the principal sedimentary basins identified: CV (Central Valley), UB (Uinta Basin), GRB (Green River<br />
Basin), YS (Yellowstone), WB (Washakie Basin), PRB (Powder River Basin), DB (Denver Basin), AB (Albuquerque Basin), PB<br />
(Permian Basin), AB (Anadarko Basin). In addition, we perform surface wave tomography based on teleseismic earthquakes with<br />
the same station set using more than 200 earthquakes in two-plane-wave tomography (TPWT) to produce Rayleigh wave dispersion<br />
maps at from 25 to 144 sec. At In overlapping period band (25-40s) the two methods produce similar dispersion maps.<br />
With these dispersion maps from 8 to 144 sec period, we apply Monte-Carlo inversion to construct a 3-D shear velocity model<br />
on the western US and the transition region to cratonic North America. Figure 2 shows a cross section of the 3model along<br />
40oN in which geological provinces are shown: BR (Basin and Range), CP (Colorado Plateau), RM (Rocky Mountains), and GP<br />
(Great Plains). Low velocities are observed in the Great Plains and the northern Colorado plateau in the shallow crust, which<br />
coincides with sedimentary basins. In the mantle, low velocity anomalies are observed beneath the entire Basin and Range province<br />
extending from 113oW to 120oW. High velocity anomalies beneath the Colorado Plateau and the Great Basin extend to<br />
the depth of ~150km, indicating thickened lithosphere. The high horizontal velocity gradient along the Rocky Mountain front<br />
reveals the boundary between the tectonic western US and the cratonic eastern US. Future work will assimilate body wave information<br />
(receiver functions) and geothermal information to reduce the crustal thickness-velocity trade-off.<br />
References<br />
Yang, Y., M. H. Ritzwoller, F.-C. Lin, M. P. Moschetti, and N. M. Shapiro (2008), Structure of the crust and uppermost mantle beneath the western<br />
United States revealed by ambient noise and earthquake tomography, J. Geophys. Res., 113, B12310<br />
Acknowledgements: All data used were obtained from the <strong>IRIS</strong> Data Management Center. The authors are grateful to Hersh Gilbert for providing<br />
the crustal thickness map.<br />
Figure1. Rayleigh wave phase velocity map derived from ANT at 12 s period<br />
where the main geological units are outlined with black contours and the principal<br />
sedimentary basins and hotspot are identified with abbreviations.<br />
Figure2. Vertical cross section of shear wave velocity along 40°N delineated by<br />
the black line in Figure 1, where the crustal part is plotted as absolute shear<br />
velocity and the mantle is plotted as the shear velocity perturbation relative to<br />
the average velocity profile.<br />
2010 <strong>IRIS</strong> Core Programs Proposal | <strong>Volume</strong> <strong>II</strong> | Lithosphere, Lithosphere/Asthenosphere Boundary | <strong>II</strong>-161


